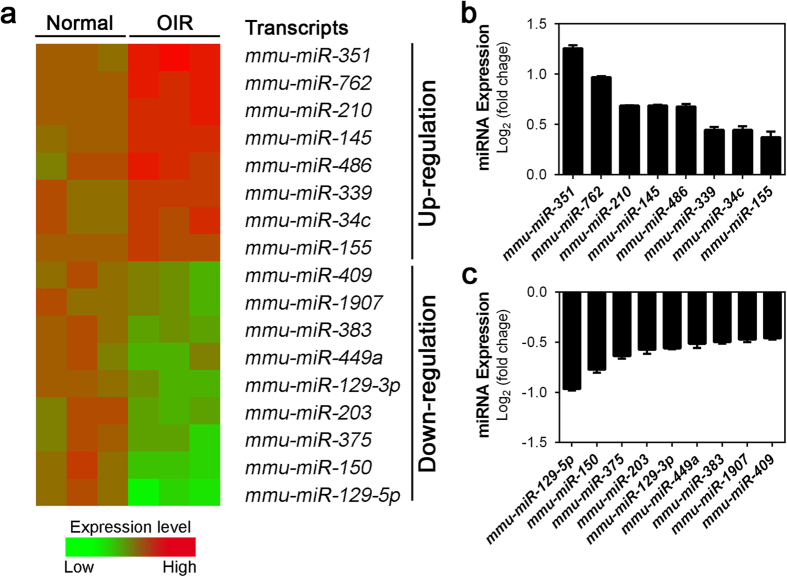
Figure 2. Expression levels of significantly altered miRNAs in OIR retinas.
(a) A heat map illustrates selected mature miRNAs with levels significantly changed in OIR retinas at P17, as analyzed from array results. Red indicates up-regulated expression levels; green indicates down-regulated expression levels, as compared with mean levels from three normoxic control samples. (b,c) Significant fold-changes of miRNAs in OIR retinas versus normoxic controls expressed in log2 scale. Eight miRNAs (miR-351, -762, -210, -145, -486, -339, -34c, and -155) were substantially up-regulated (b), and nine miRNAs (miR-129-5p, -150, -375, -203, -239-3p, -449a, -383, -1907 and -409) were substantially down-regulated in OIR retinas (c). Data were presented as mean ± standard error of the mean (SEM).

