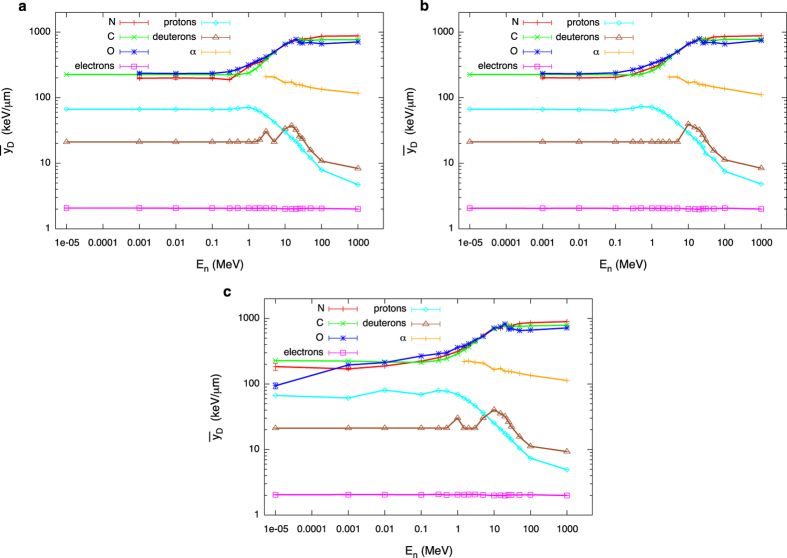
Figure 3. Variation with neutron energy and location in the phantom of the dose mean lineal energy of secondary charged species.
Dose-mean lineal energy values for secondary charged species accelerated by neutrons as a function of neutron initial energy: (a) inner; (b) intermediate; (c) outer scoring region. Error bars are standard deviations among different PHITS runs and are in most cases within the symbols. Lines are drawn to guide the eye.

