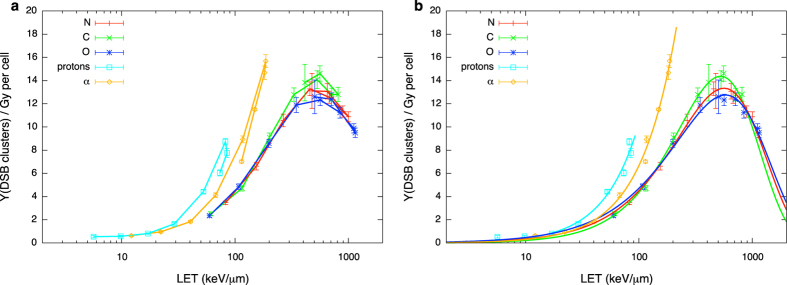
Figure 5. Charged particle induced DSB clusters as a function of LET.
Yield of DSB cluster (as defined in the text) per Gy per cell as a function of LET for different charged particle species. Lines are drawn to guide the eye in panel (a), while analytical best fit functions (equation (6)) are plotted in panel (b). Error bars are given taking into account propagation of standard deviations among different PARTRAC runs for DSB cluster yield and dose to the nucleus.

