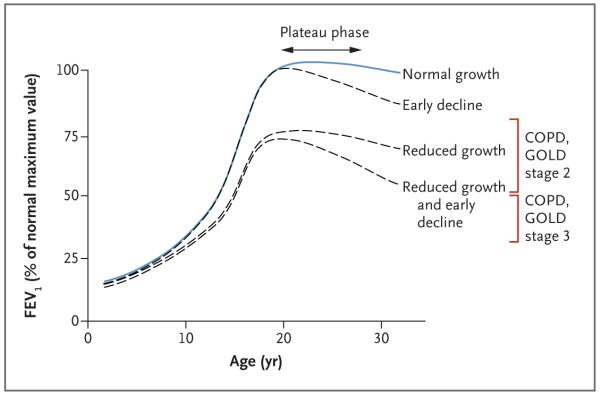
Figure 1. Longitudinal Lung-Function Trajectories.
Possible lung-function trajectories during the first three decades of life are shown; the lung function plotted for each age is the percentage of the maximum forced expiratory volume in 1 second (FEV1) in a person without lung disease; the maximum value is usually attained at the age of 18 to 30 years. A normal pattern of lung-function growth and decline is characterized by a steep increase during adolescence, a plateau in early adulthood, and a gradual decline into old age. Abnormal trajectories include reduced growth, normal growth and an early decline, and reduced growth and an early decline. The red brackets indicate FEV1 criteria according to Global Initiative for Chronic Obstructive Lung Disease (GOLD) stage 2 (FEV1 ≥50% and <80%) and stage 3 (FEV1 ≥30% and <50%) of chronic obstructive pulmonary disease (COPD), when accompanied by a ratio of FEV1 to forced vital capacity that is less than 0.70. The figure is adapted from Speizer and Tager.1

