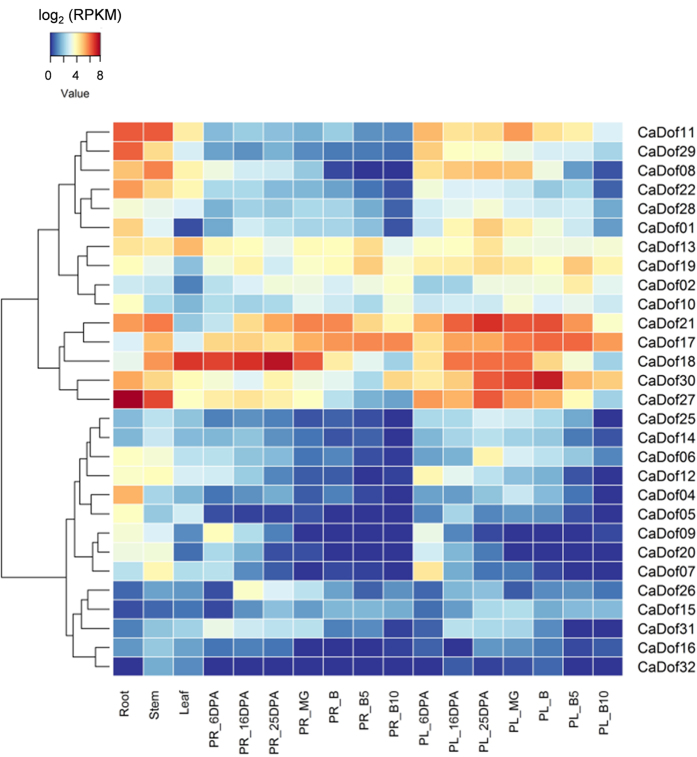
Figure 5. Tissue specific expression analysis of CaDofs.
The heat map was constructed by RNA-seq from C. annuum ‘CM334’. The 29 CaDof genes were used to construct heat map. The 4 CaDof genes (CaDof03, 23, 24, and 33), which are absent data, were excluded. Blue and red colors represent relatively low and high expression (log2 RPKM value), respectively. PR, pericarp; PL, placenta; MG, mature green stage; B, breaker stage; DPA, days post-anthesis; B5 and 10, 5 and 10 days post-breaker.

