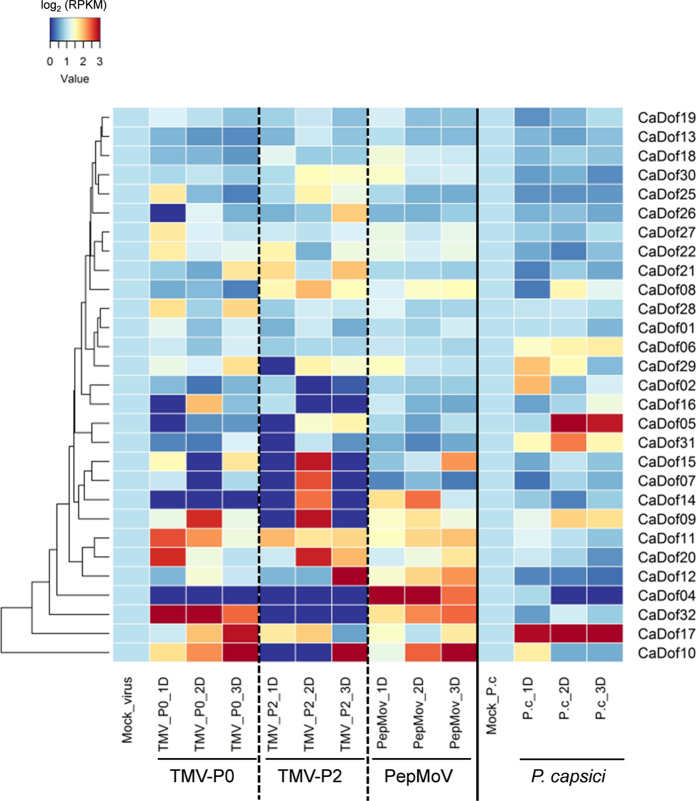
Figure 6. Biotic stress specific expression analysis of CaDofs.
The heat map was constructed by RNA-seq from three viruses (TMV-P0, TMV-P2 and PepMoV) and Phytophthora capsici inoculated C. annuum ‘CM334’. ‘CM334’ is resistant to TMV-P0, PepMoV, and P. capsici but susceptible to TMV-P2.The 29 CaDof genes were used to construct heat map. The 4 CaDof genes (CaDof03, 23, 24, and 33), which are absent data, were excluded. For expression pattern after virus inoculation, mean of RPKM value in triplicate data sets were used. This data was normalized by control samples (Mock_virus and Mock_P.c). Blue and red colors represent relatively low and high expression (log2 RPKM value), respectively. P.c, Phytophthora capsici; D, days post inoculation.

