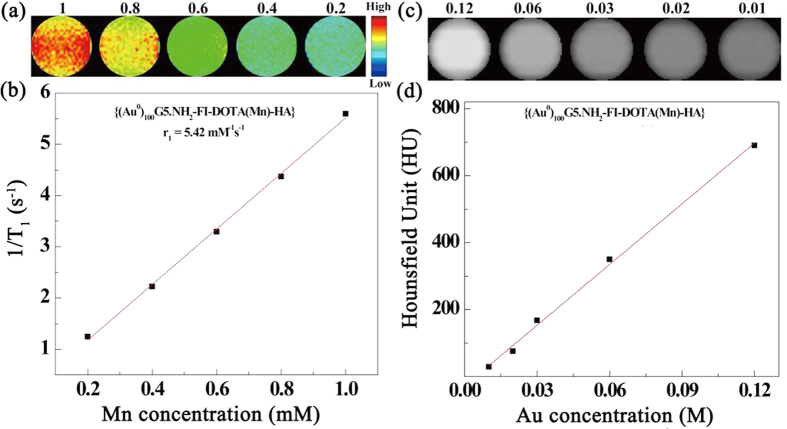
Figure 3.
T1-weighted MR imaging (a) and linear fitting of 1/T1 (b) of the {(Au0)100G5.NH2-FI-DOTA(Mn)-HA} NPs at Mn concentrations of 0.2, 0.4, 0.6, 0.8, and 1 mM. CT phantom images (c) and X-ray attenuation (HU) (d) of the {(Au0)100G5.NH2-FI-DOTA(Mn)-HA} NPs as a function of Au concentration (0.01, 0.02, 0.03, 0.06, and 0.12 mM).

