Fig. 2.
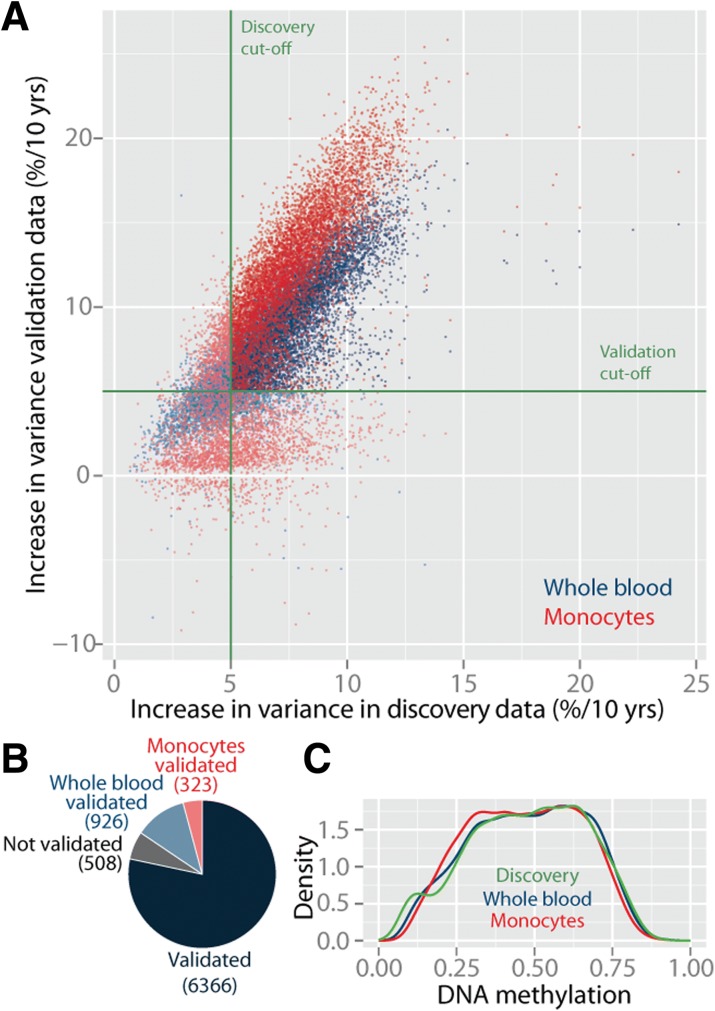
Validation of aVMPs in whole blood of 643 and purified monocytes of 1202 individuals. a Change in variability in the discovery (x-axis) against the whole blood and monocyte validation (y-axis) datasets. Red dots represent the monocyte validation dataset, blue dots represent the whole blood validation dataset. b The aVMPs that validate in whole blood and monocytes. c Density plot of average DNA methylation of validated aVMPs in the discovery dataset and validation datasets

