Fig. 5.

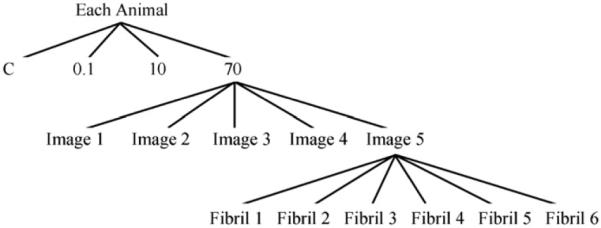
Sample tree for fascicles undergoing D-period analysis. A sample size of n=90 was the total number of fibrils coming from all 3 animals (3 animals × 5 images × 6 fibrils). Each fibril measurement represented an average of 40 ± 9 D-periods.

Sample tree for fascicles undergoing D-period analysis. A sample size of n=90 was the total number of fibrils coming from all 3 animals (3 animals × 5 images × 6 fibrils). Each fibril measurement represented an average of 40 ± 9 D-periods.