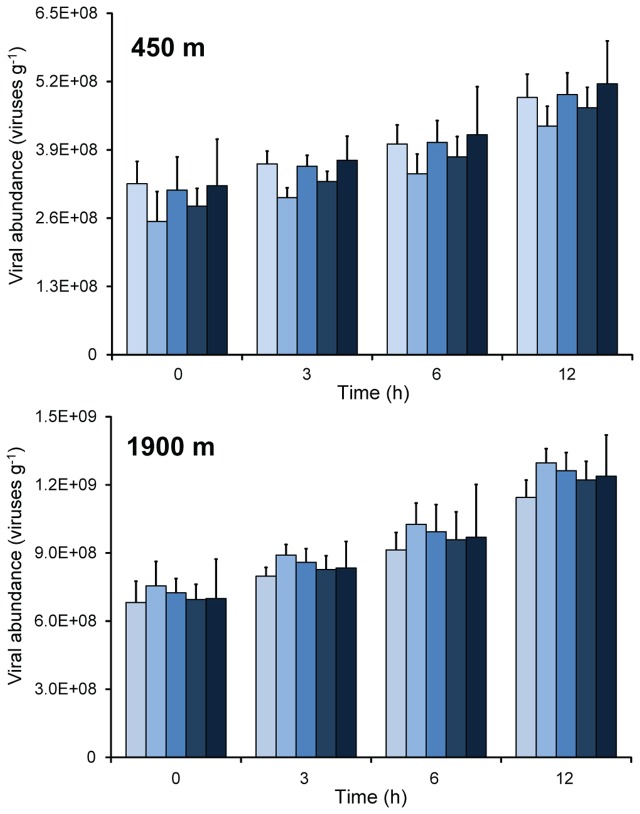
FIGURE 1.
Changes of viral abundance during time course incubation experiments carried out on sediment samples collected at the two benthic deep-sea sites (at 450 and 1900 m water depth). The bars refer to, from light to dark blue: sediments diluted 1:1, 1:5, and 1:10 times; homogenized and undiluted; intact sediment cores. Mean values (n = 3) and SDs are reported.

