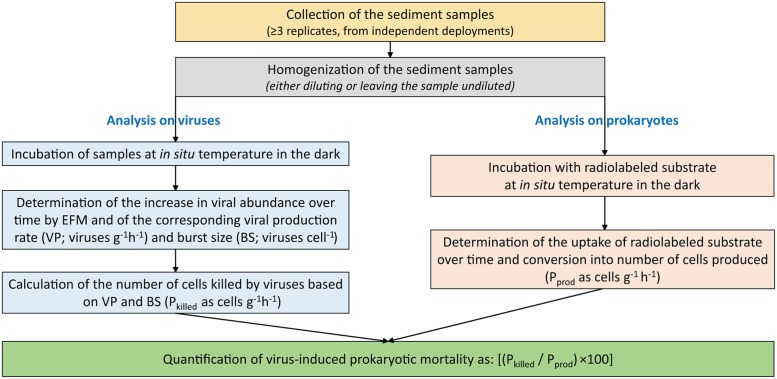
FIGURE 5.
Diagram for the quantification of the viral production in benthic ecosystems. Reported is the flow chart of the different steps required for the analysis of viruses and prokaryotes and the impact of viruses on their hosts. Pkilled is the number of prokaryotic cells killed by viruses; Pprod is the number of prokaryotic cells produced. Details are in the “Materials and Methods” section.

