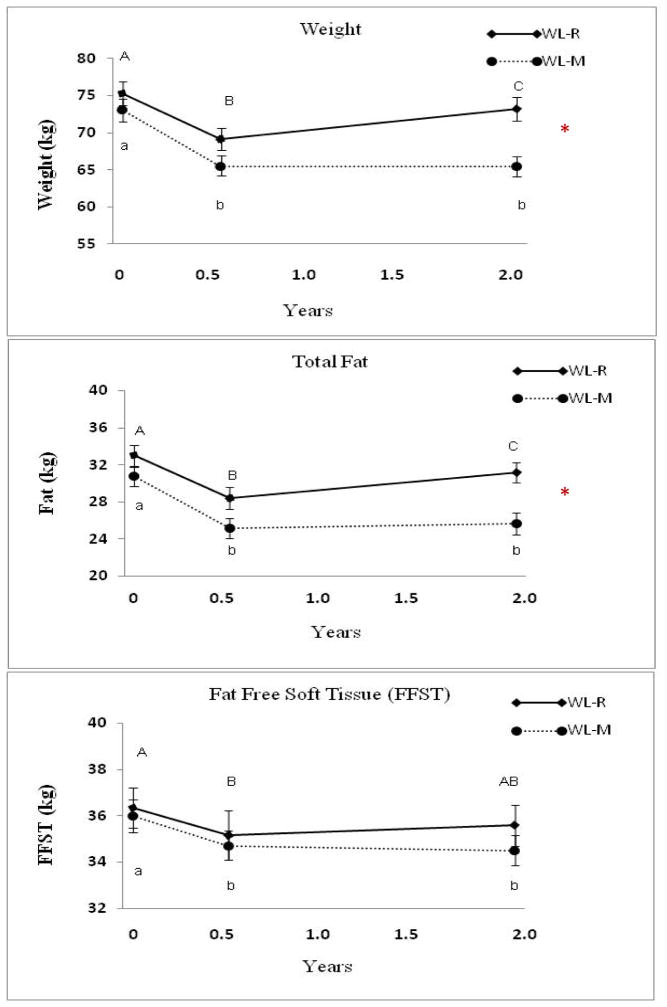
Figure 2.
Weight (kg), fat and fat-free soft tissue at baseline, the end of the weight loss intervention (0.5 y) and after 2 years in the Weight Loss Maintenance (WL-M, n= 22) and Weight Loss Gain (WL-R, n=20) groups. Data (Mean ± SEM). * Repeated Measures ANOVA differs between groups, p < 0.05. The only time point that differed between groups was at 2 years for weight and fat (p < 0.001).
Values with different letters are significantly different, p < 0.05. Upper and lower case letters are used to denote WL-R and WL-M, respectively.

