
Figure 2.
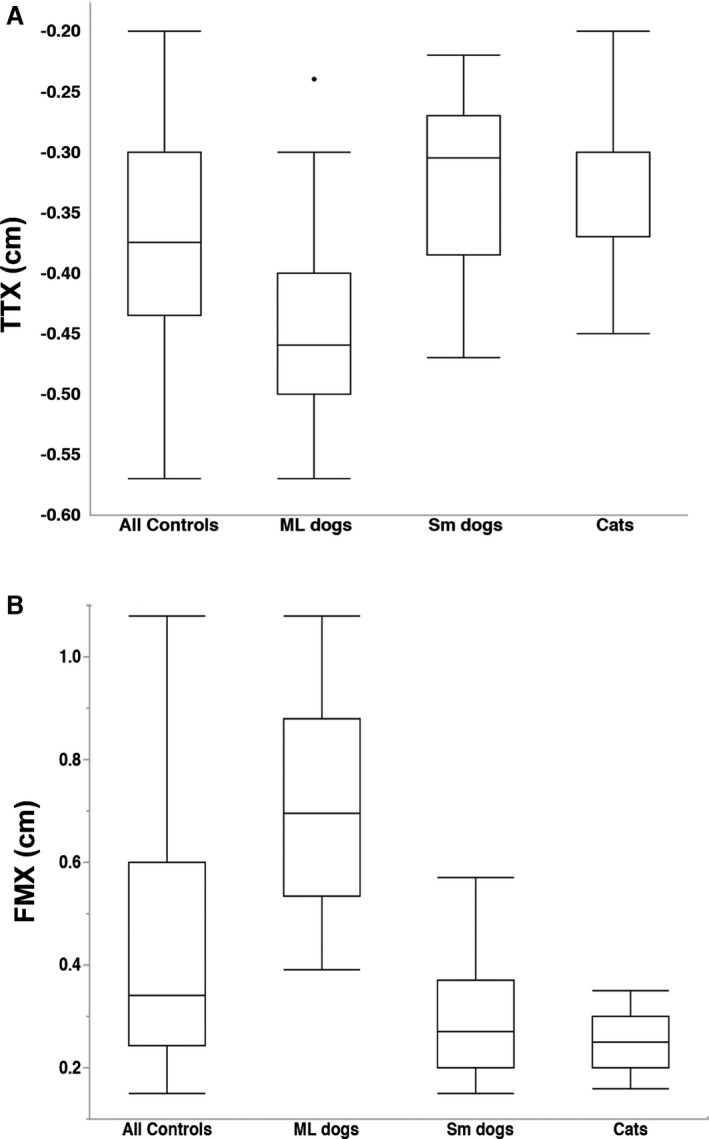
Measurements in control animals and subdivided by dog size and species. (A) TTX for all controls was significantly different from ML dogs (P < 0.001), Sm dogs (P = 0.009) and cats (P = 0.005) and ML dogs were significantly different from Sm dogs and cats (both P < 0.001). (B) FMX for all controls was significantly different from ML dogs (P < 0.001), Sm dogs (P = 0.002) and cats (P < 0.001) and ML dogs were significantly different from Sm dogs and cats (both P < 0.001). Tukey boxplots depicting median, minimum and maximum values within 1.5 times the Interquartile Range (IQR) and outliers for each group. ML: medium/large, Sm: small, TTX: transtentorial to rostroventral cerebellum line. FMX: caudoventral cerebellum to foramen magnum line.