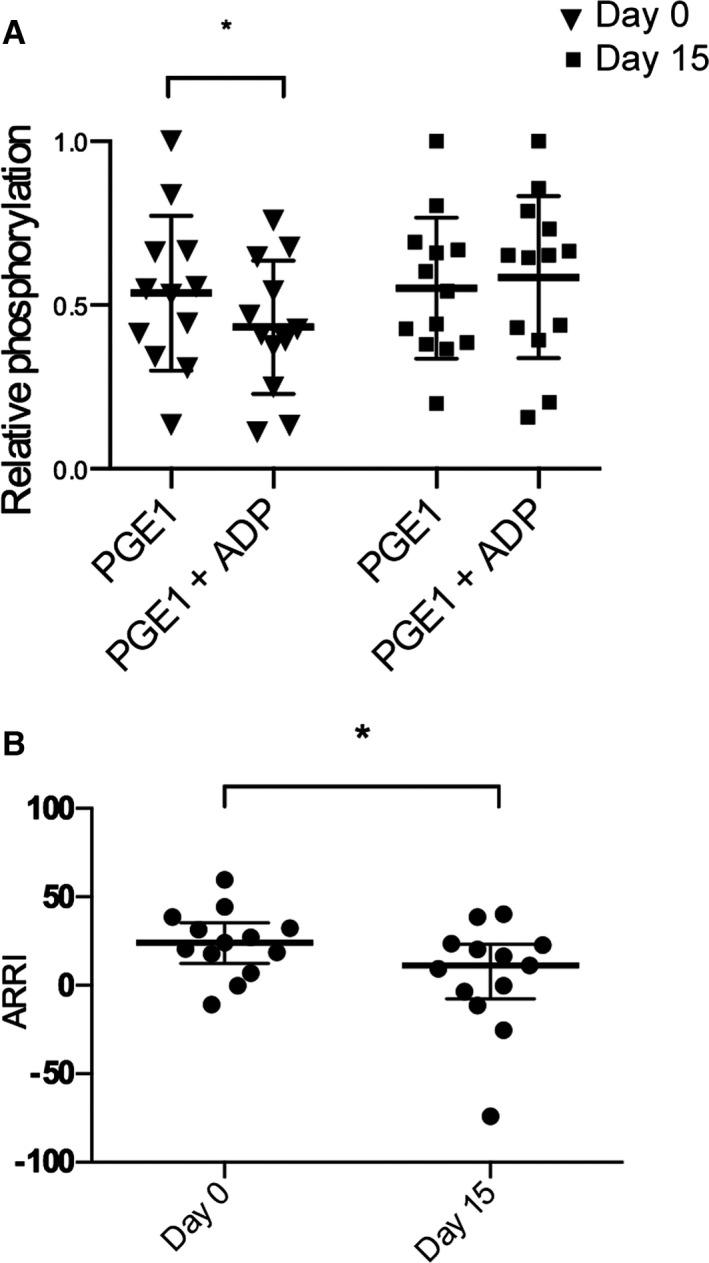
Figure 7.

(A) Relative phosphorylation of vasodilator‐stimulated phosphoprotein (VASP) quantified by Western blot analysis in platelets from 12 cats before (day 0) and after 14 days (day 15) of clopidogrel treatment. (B) ADP receptor response index (ARRI) in 12 cats before (day 0) and after 14 days (day 15) of clopidogrel treatment. The bolded line represents the mean, and the upper and lower lines represent the interquartile range.
