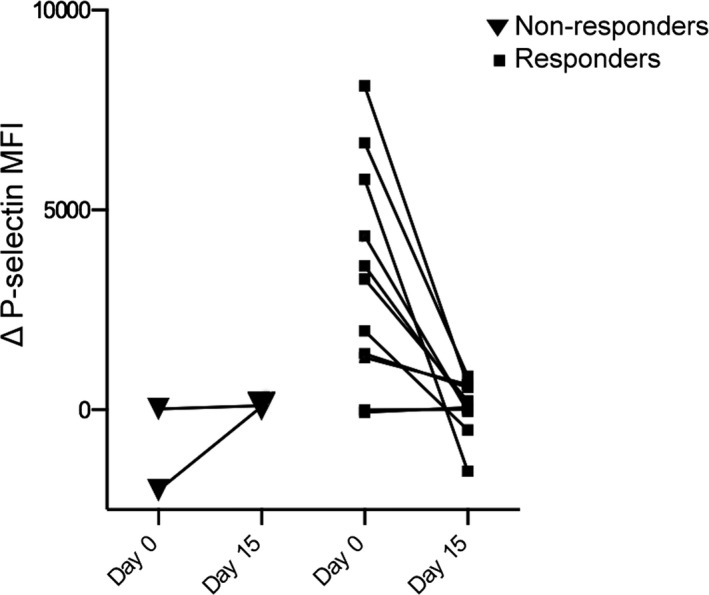
Figure 8.

Line plots illustrating the changes in P‐selectin expression before and after 14 days of clopidogrel treatment in 11 responders and 2 nonresponders. On day 15, the differences in P‐selectin mean MFI between resting and ADP‐stimulated platelets in nonresponders were higher than those on day 0. All responders but one had an attenuated response to ADP stimulation.
