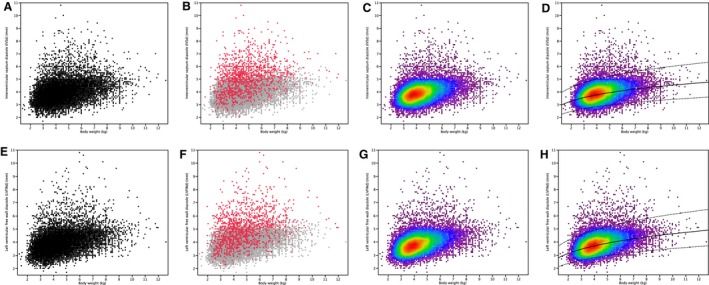
Figure 1.

Scatter plots and heat maps of diastolic left ventricular wall thicknesses plotted against body weight in 19,866 cats. Figures A–D show plots of diastolic interventricular septal wall thickness; Figures E–H show plots of diastolic free wall thickness. Figures A and E: all cats (n = 19,866). Figures B and F: cats with abnormal echocardiograms (n = 1,406, red dots) and cats with normal echocardiograms (n = 18,460, gray dots). Figures C and G: heat maps of all cats (n = 19,866). Figures D and H: heat maps as in Figures C and G, with superimposed regression line (solid line) and 95% prediction intervals (dotted lines) (n = 19,866). In Figures C, D, G and H, dots are coded according to their density at each point in the plot, from purple (<5% of the observations below) to dark red (95% of the observations below). Each color represents 5% intervals.
