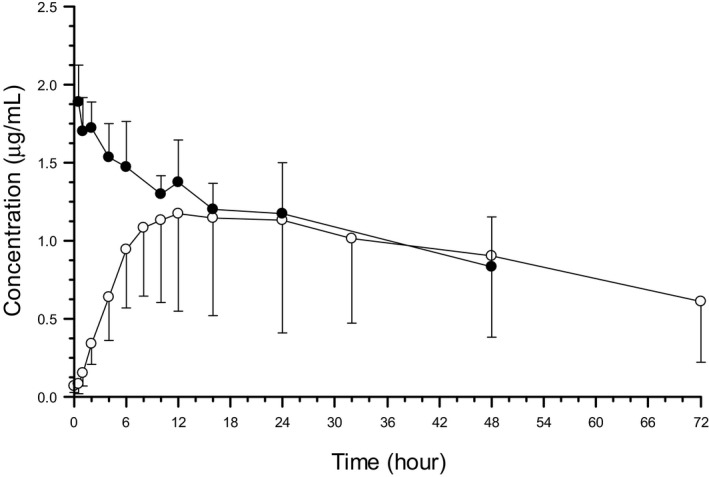
Figure 1.

Posaconazole plasma concentrations in cats after administration of an IV solution (3 mg/kg [black circles]; n = 4) and an oral suspension (15 mg/kg [open circles]; n = 6). Time 0 = Time of administration. Values reported are mean + SD concentration after administration of the IV solution and mean – SD concentration after administration of the oral suspensions.
