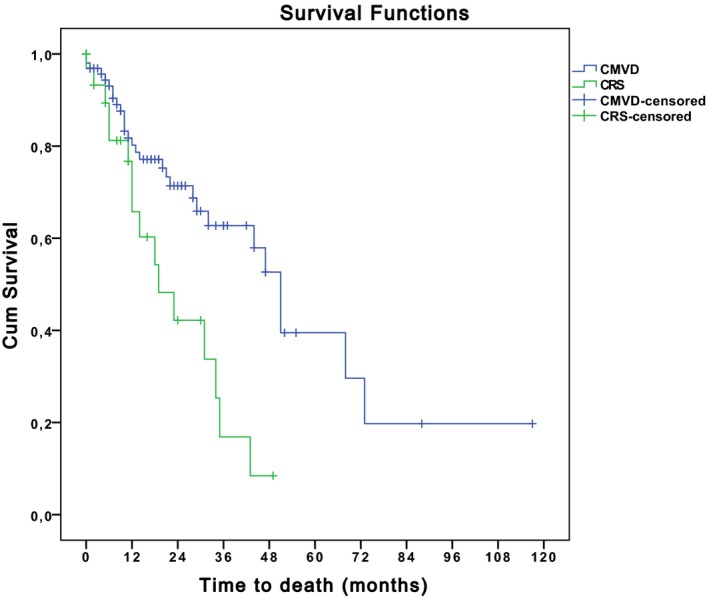
Figure 2.

Comparison of survival time between dogs affected by CRS and dogs with CMVD. Blue: dogs affected by CMVD. Green: dogs with CRS. Survival time was statistically different between dogs with CRS versus dogs with CMVD (P = .002). End‐point of the study was cardiac death. Dogs still alive at the end of the study period and dogs that died of noncardiac disease were right‐censored. The Kaplan‐Meier method was used to estimate survival function and plot time to event curves in the different groups and equality of survival distributions was tested by Log Rank.
