
Figure 2.
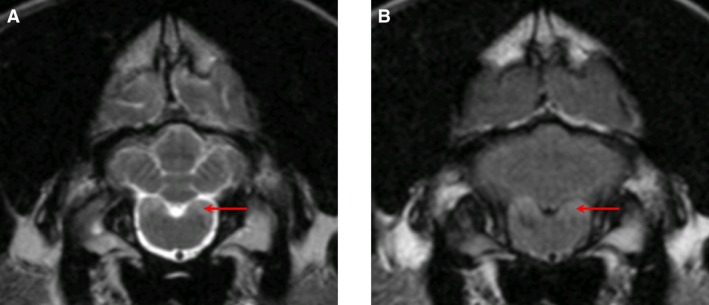
MR images from Dog #2. T2‐weighted (A) and FLAIR (B) transverse images at the level of the lateral cuneate nuclei showing a hyperintense signal (red arrow).
Official websites use .gov
A
.gov website belongs to an official
government organization in the United States.
Secure .gov websites use HTTPS
A lock (
) or https:// means you've safely
connected to the .gov website. Share sensitive
information only on official, secure websites.
MR images from Dog #2. T2‐weighted (A) and FLAIR (B) transverse images at the level of the lateral cuneate nuclei showing a hyperintense signal (red arrow).