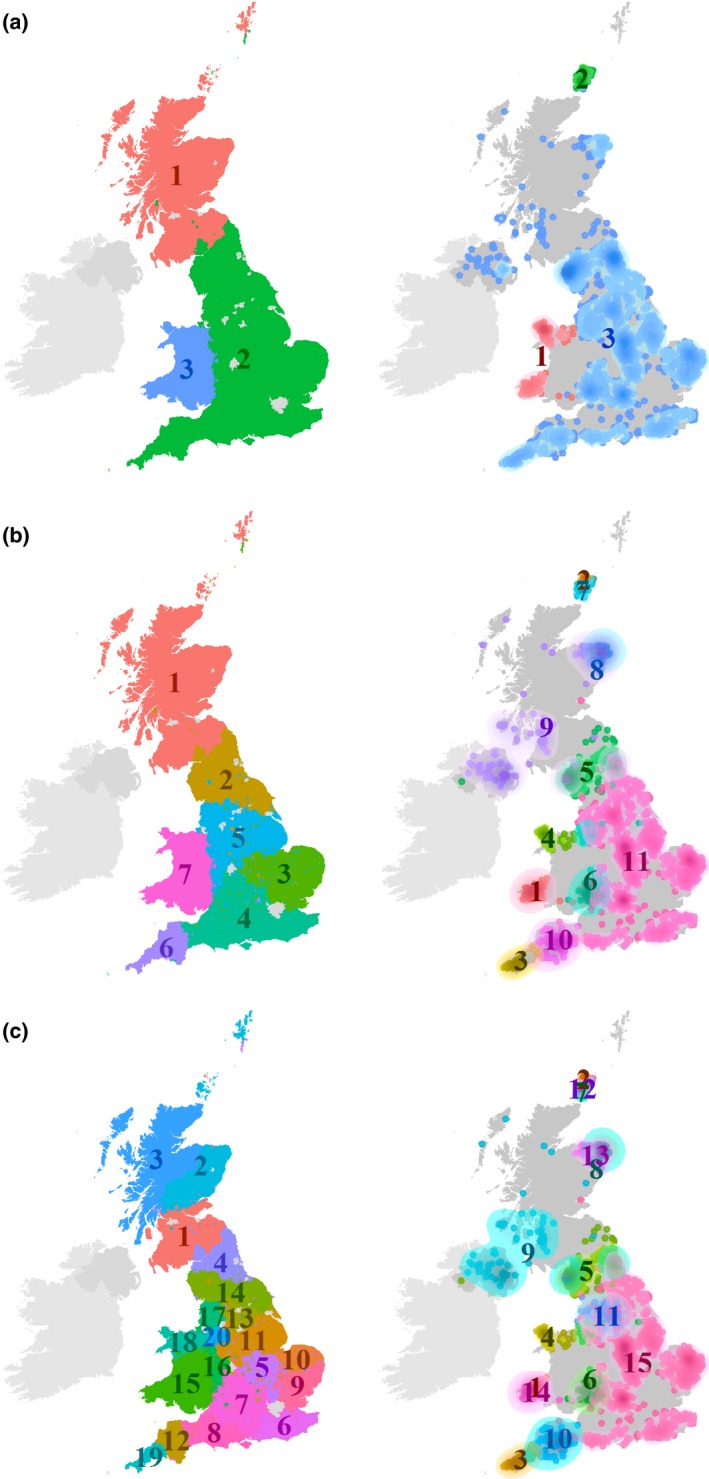
Figure 3.

Isonymy groups (left) and the geographic distribution of genetic clusters (right). (a) k = 3 isonymy groups and l = 3 genetic clusters with R adj = .605. (b) k = 7 isonymy groups and l = 11 genetic clusters with R adj = .284. (c) k = 20 isonymy groups and l = 15 genetic clusters with R adj = .158
