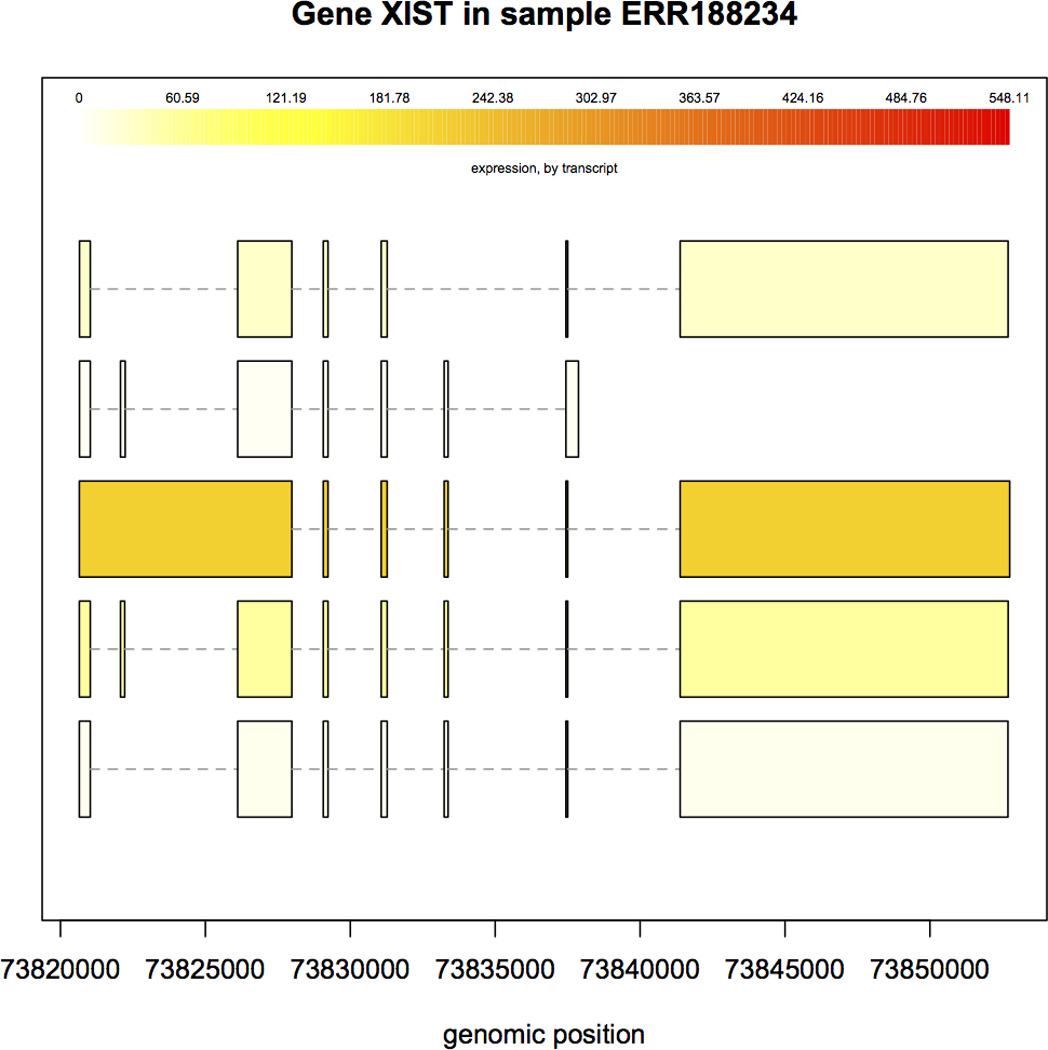
Figure 5.

Structure and expression levels of five distinct isoforms of the XIST gene in sample ERR188234. Expression levels are shown in varying shades of yellow. The third isoform is expressed at a much higher level than the others, as indicated by the darker color.
