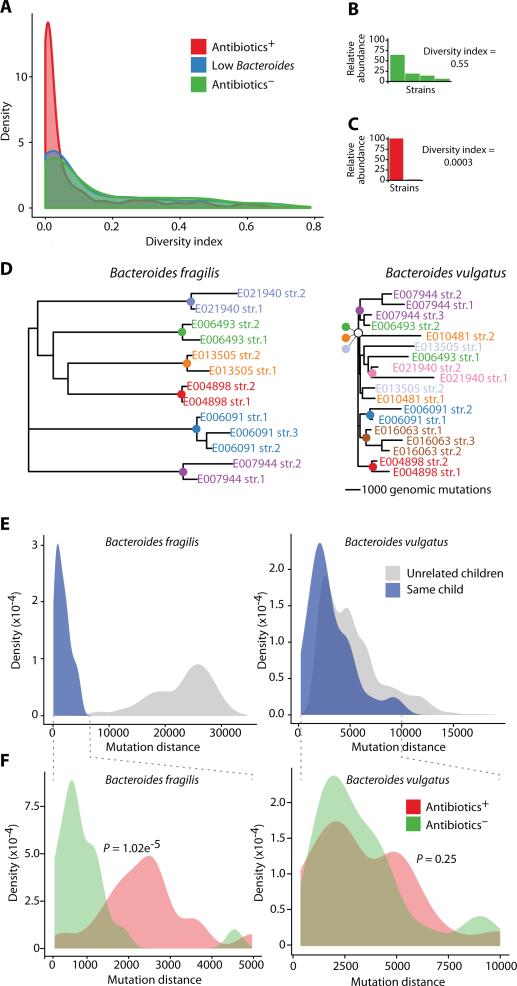
Fig. 2.
Diversity and strain similarities of the infant gut microbiota. (A) Diversity index of the strain distribution within each species shown for all metagenomic samples. Samples are colored according to three groups: children who received antibiotics (red), children with low Bacteroides (blue), and children who received no antibiotics (green). (B-C) Strain distributions of two selected samples (y-axis is relative abundance of each strain), and their calculated diversity indices. The selected samples were E032966, month 24 (B) and E006091, month 23 (C). (D) Partial phylogenetic trees based on the mutation distance between all strains of B. fragilis (left) and B. vulgatus (right). Strains are colored by the child in whom they were detected, and colored nodes represent the most recent common ancestor of the strains found in that child (scale bars of 1,000 mutations are shown per tree; Full trees appear in fig. S8). (E) Distributions of the mutation distance for all pairwise comparisons of B. fragilis (left) and B. vulgatus (right) strains, within (blue) or across (gray) individuals. (F) Distributions of mutation distances within individuals, colored as Antibiotics− (green), or Antibiotics+ (red), with P values for the separation of these two distributions (Kolmogorov-Smirnov (KS)-test) for B. fragilis (left) and B. vulgatus (right) strains.

