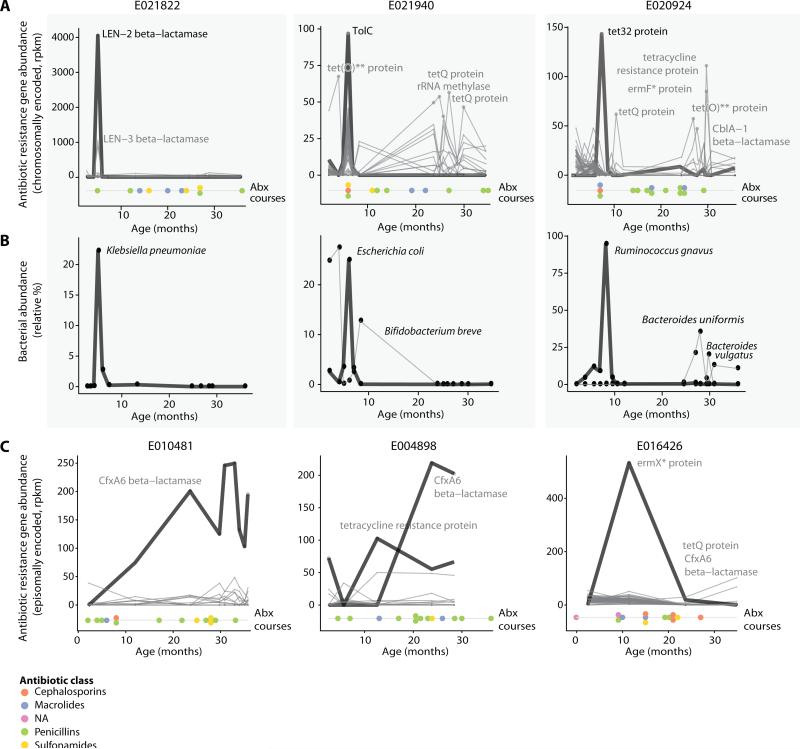
Fig. 4.
Antibiotic resistance gene profiles. (A) Abundance of antibiotic resistance (AR) gene products (mostly chromosomally encoded, rpkm values) in three children over time, together with the timing of individual antibiotic courses (colored dots; see figure S10 for plots for all children). (B) Relative abundance of species most correlating with the resistance gene profiles of panel (A). (C) Examples as in (A) of AR genes found on mobile elements and that are present in the gut for longer time periods. In (A) and (C), the number and order of antibiotic courses are shown with each antibiotic class indicated by color.

