Figure 4.
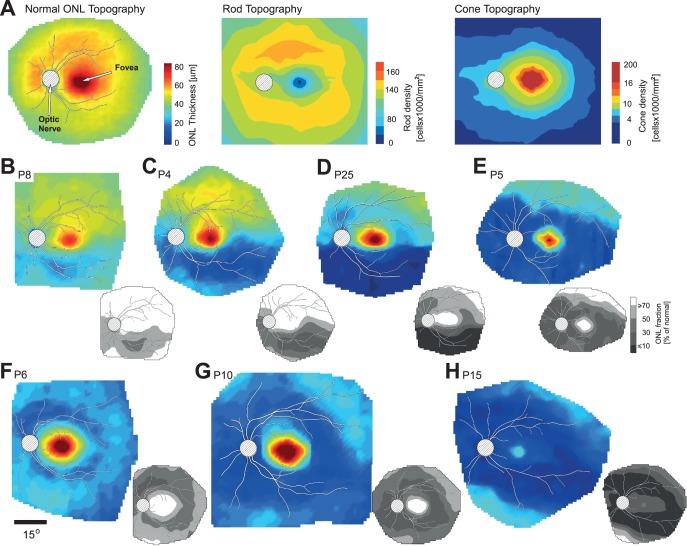
ONL thickness topography maps in the central retina of RHO mutation patients. (A) Left: normal ONL thickness topography (average of data from five subjects with normal vision; ages 22–32 years). Middle: rod topography based on photoreceptor density map.23 Right: cone topography. Pseudocolor scales have been adjusted to allow comparison with the ONL thickness topography maps. (B–E) Examples of ONL thickness topography with different degrees of altitudinal and pericentral loss of photoreceptors in the central retina of patients with RHO mutations. (F–H) Examples of patients showing pericentral ONL loss without an altitudinal defect. All images are depicted as left eyes. Grayscale maps at the lower right corner of the ONL thickness map represent ONL as fraction of average normal ONL thickness. Each map has overlaid traces of major blood vessels for reference; location of optic nerve is shown as hatched circle. Pseudocolor scales are the same for all ONL thickness maps and shown at the right side of normal ONL in (A); value of the gray levels is shown in (E). Spatial scale for all pseudocolor images is shown below (F).

