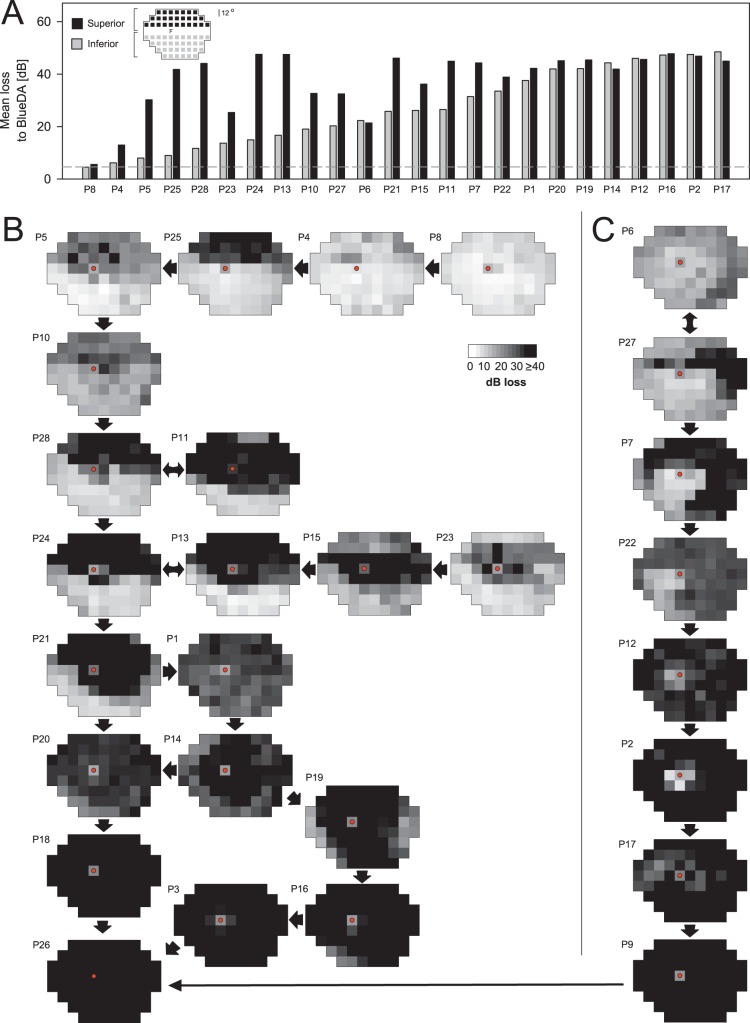
Figure 5.
Rod sensitivity loss (RSL) across the visual field and hypothetical disease sequence in class B patients from RSL maps. (A) Average RSL for superior (black bars) and inferior (gray bars) hemifields in 24 patients with measurable rod function outside the central field. Patient results are ordered left to right by increasing inferior field losses. Test loci with vertical eccentricities less than 4° were excluded from either average. Inset: subsets of loci in each hemifield average. Dashed line: 2 SD limit for normal subjects. (B, C) RSL is mapped throughout the visual field in grayscale for one eye of each of the 28 patients. Arrows indicate a presumed progression from mild to more severe phenotypes, although this was not always possible. Fixation is marked with a red dot. Rod sensitivity may be nearly normal in early disease stages, and then RSL continues in a recognizable pattern with the development of superior hemifield defects and pericentral dysfunction. Most severe stages (lowest maps) show no evidence of rod function.

