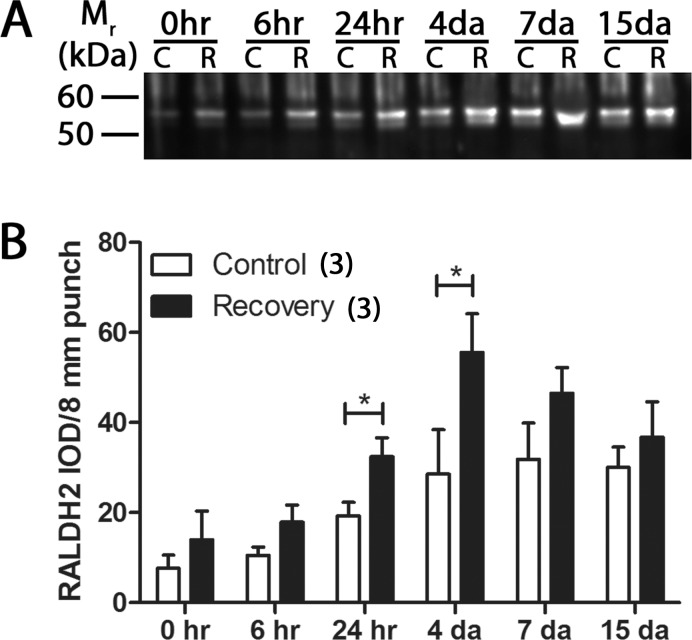
Figure 5.
Western blot analysis and quantification of RALDH2 in choroids over a 15-day recovery period. (A) Cytosol fractions from control (C) and recovering (R) choroids were immunoblotted with anti-chick RALDH2 at various time points during the course of recovery. RALDH2 immunopositive bands (∼55 kDa) were present in control and recovering choroids at all time points examined. Blot shown is representative of 3 independent blots. (B) Average RALDH2 abundance (± SEM) in control and recovering choroids was measured as the IOD per 8 mm biopsy punch (n = 3 for each time point). *P < 0.05 (Wilcoxon matched-pairs signed rank test).

