Figure 7.
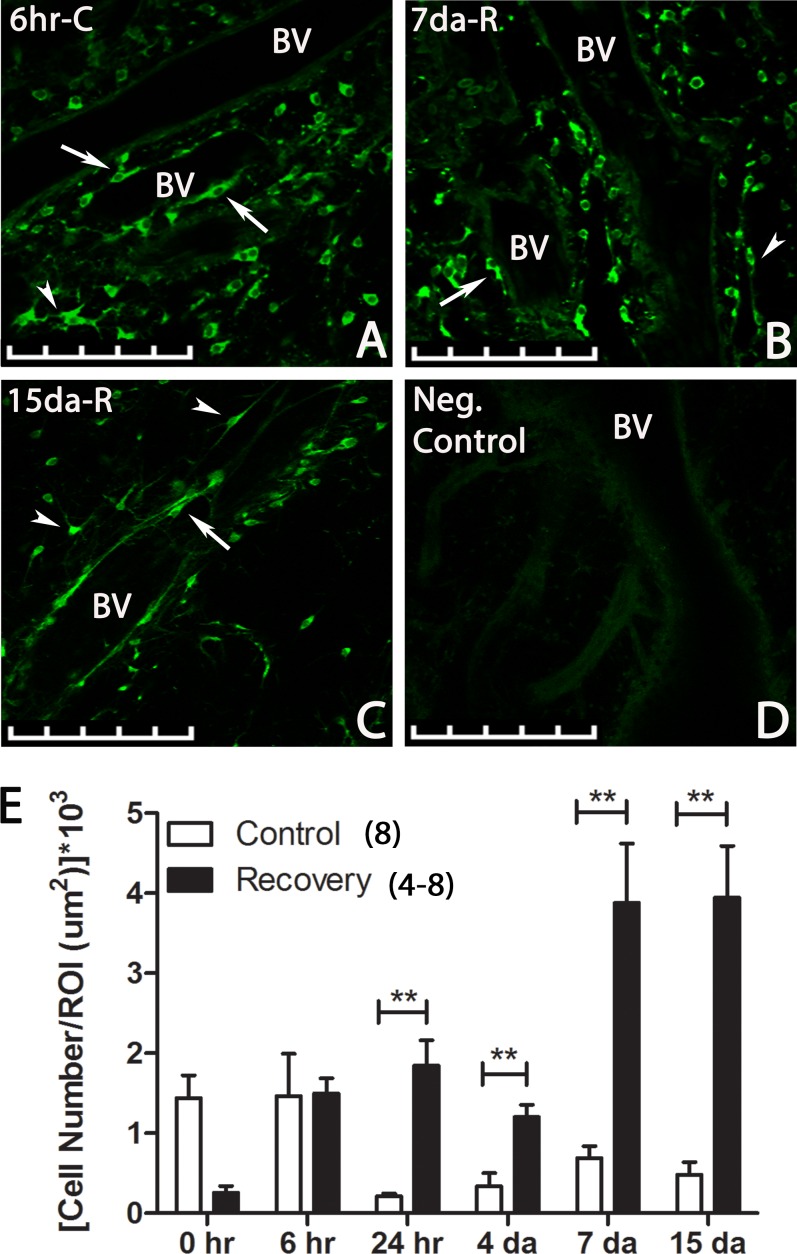
Multiphoton images and quantification of RALDH2 expressing cells (green) in control and recovering choroids after immunolabeling with the anti-chick RALDH2 antibody. (A–C) Images of representative RALDH2 immunopositive cells in choroids throughout recovery. RALDH2 labeling was detected in round or spindle-shaped cell bodies with some cells exhibiting long, thin projections (arrowhead). Some choroidal stromal cells were located in close association with blood vessels (arrow). BV, blood vessel; 6hr-C, 6-hour control; 7da-R, 7-day recovery; 15da-R; 15-day recovery. (D) Negative control choroid (incubation in preimmune rabbit serum instead of primary antibody) demonstrating absence of labeling in the tissue. Scale bars: 100 μm in (A–D). (E) Average total RALDH2 cell number (± SEM) in control and recovering choroids (30–300 μm thick z-stacks) at various time points throughout recovery. Results were normalized to cross-sectional area for each ROI selected to perform the counting (n = 4–8). **P < 0.01 (paired t-test).

