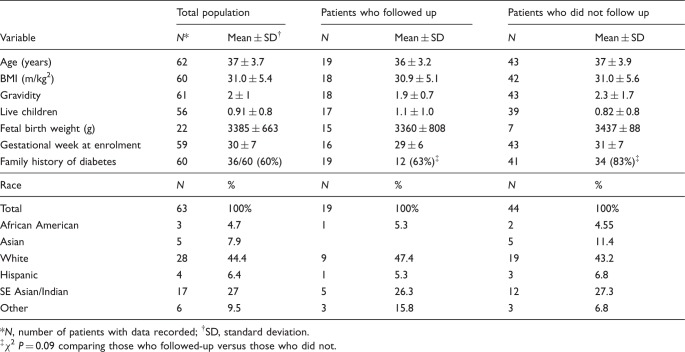
Table 1.
Patient demographics.
| Total population |
Patients who followed up |
Patients who did not follow up |
||||
|---|---|---|---|---|---|---|
| Variable | N* | Mean ± SD† | N | Mean ± SD | N | Mean ± SD |
| Age (years) | 62 | 37 ± 3.7 | 19 | 36 ± 3.2 | 43 | 37 ± 3.9 |
| BMI (m/kg2) | 60 | 31.0 ± 5.4 | 18 | 30.9 ± 5.1 | 42 | 31.0 ± 5.6 |
| Gravidity | 61 | 2 ± 1 | 18 | 1.9 ± 0.7 | 43 | 2.3 ± 1.7 |
| Live children | 56 | 0.91 ± 0.8 | 17 | 1.1 ± 1.0 | 39 | 0.82 ± 0.8 |
| Fetal birth weight (g) | 22 | 3385 ± 663 | 15 | 3360 ± 808 | 7 | 3437 ± 88 |
| Gestational week at enrolment | 59 | 30 ± 7 | 16 | 29 ± 6 | 43 | 31 ± 7 |
| Family history of diabetes |
60 | 36/60 (60%) | 19 | 12 (63%)‡ | 41 | 34 (83%)‡ |
| Race |
N | % | N | % | N | % |
| Total | 63 | 100% | 19 | 100% | 44 | 100% |
| African American | 3 | 4.7 | 1 | 5.3 | 2 | 4.55 |
| Asian | 5 | 7.9 | 5 | 11.4 | ||
| White | 28 | 44.4 | 9 | 47.4 | 19 | 43.2 |
| Hispanic | 4 | 6.4 | 1 | 5.3 | 3 | 6.8 |
| SE Asian/Indian | 17 | 27 | 5 | 26.3 | 12 | 27.3 |
| Other | 6 | 9.5 | 3 | 15.8 | 3 | 6.8 |
*N, number of patients with data recorded; †SD, standard deviation.
‡ χ 2 P = 0.09 comparing those who followed-up versus those who did not.

