
Figure 2.
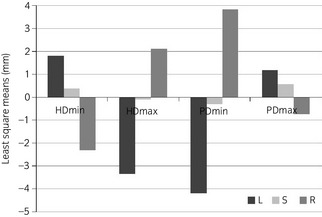
Least square means (mm) from mixed model analysis of HDmin, HDmax, PDmin and PDmax (n = 94 horses). Significant differences were found with all pairwise comparisons between left and right (P<0.0001), for HDmin, left vs. straight (P = 0.04) and straight vs. right (P = 0.04), for HDmax and PDmin left vs. straight and straight vs. right (P<0.0001) and for PDmax straight vs. right (P<0.0001) but not PDmax left vs. straight (P = 0.28). HD = head; PD = pelvis; L = left; S = straight; R = right.