
Figure 4.
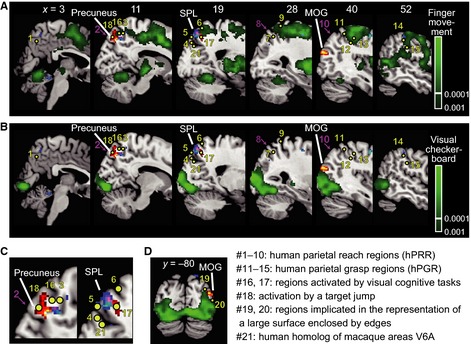
Comparison of Dot/Bkg clusters in Experiment 1 (hot color, precuneus, MOG) and Dot/Ego clusters in Experiment 2 (cool color, SPL) with regions (indicated by green) significantly activated by (A) sequential opponent finger movements and by (B–D) visual stimuli (checker board patterns) flickered at 4 Hz. The green voxels were thresholded at P < 0.001 (voxel‐level, false discovery rate‐corrected). Twenty‐one previously reported MNI coordinates are superimposed. Yellow dots indicate the peak activations as a result of motor, visual and cognitive tasks, and magenta arrows indicate transcranial magnetic stimulations that resulted in errors in reaching movements. See Table 5 for detail of the previous studies. (C) Magnified images of two panels in (B), x = 11 and 19. (D) A coronal section at y = 80.