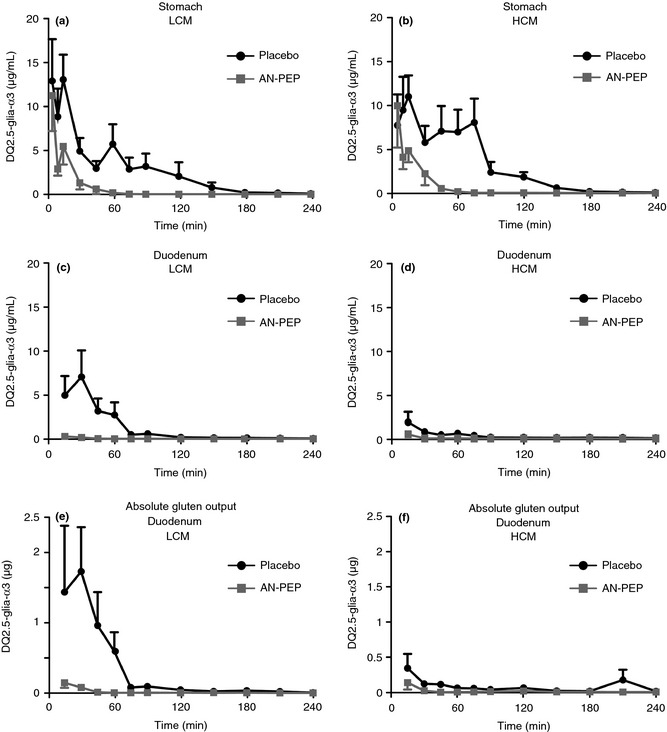
Figure 1.

(a) DQ2.5‐glia‐α3 concentration (mean ± SEM) over time in the stomach in low calorie meals. (b) DQ2.5‐glia‐α3 concentration (mean ± S.E.M.) over time in the stomach in high calorie meals. (c) DQ2.5‐glia‐α3 concentration (mean ± S.E.M.) over time in the duodenum in low calorie meals. (d) DQ2.5‐glia‐α3 concentration (mean ± S.E.M.) over time in the duodenum in high calorie meals. (e) Absolute DQ2.5‐glia‐α3 output (mean ± S.E.M.) over time in the duodenum in low calorie meals. (f) Absolute DQ2.5‐glia‐α3 output (mean ± S.E.M.) over time in the duodenum in high calorie meals.
