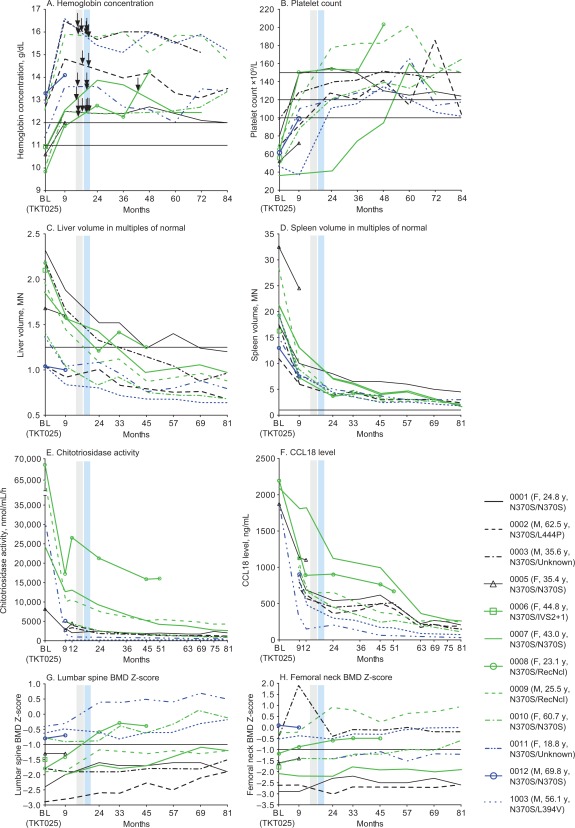
Figure 2.

Individual patient data, all patients (n = 12) for key disease parameters (hemoglobin concentration, platelet count, liver volume, spleen volume) and plasma biomarkers (chitotriosidase and CCL18). Grey and blue vertical bands denote the two phases of dose reduction: 60 to 45 U/kg, 45 to 30 U/kg. The arrows indicate the times when individual patients had a dose adjustment; patient 8 had a dose increase after initiation of the reduced dose. Horizontal lines in panels A to D, G, and H indicate thresholds for normal values: in panel A, 11 g/dL for women and 12 g/dL for men; in panel B, 100, 120, and 150 × 109/L, denoting normal and “low‐normal” thresholds; in panel C, 1.25 MN; and in panel D, 1 MN. BL: baseline; MN: multiple of normal; BMD: bone mineral density.
