
Figure 3.
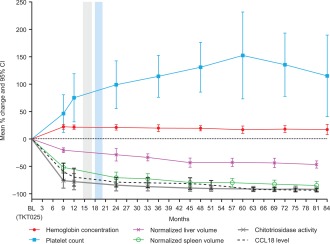
Results of the completer group, mean percentage changes by disease parameter over time; n = 8 except for hemoglobin and platelets at 84 months (where n = 6), for spleen volume at months 24, 33, 45, 57, 69, and 81 (where n = 7), and for chitotriosidase activity at all months (where n = 7). Grey and blue vertical bands denote the two phases of dose reduction that were implemented: 60 to 45 U/kg and 45 to 30 U/kg. BL: baseline.