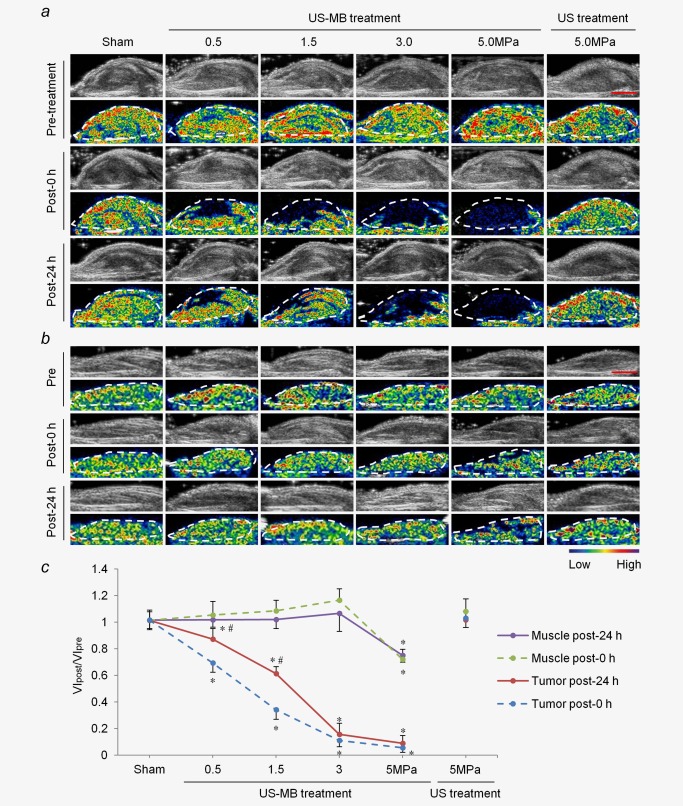
Figure 2.

Effects of LIUS‐MB treatment on blood perfusion in the tumor and muscle over time: results for various pressures. Representative B‐mode and background‐subtracted color‐coded images of the tumor (a) and muscle (b) from one animal in each group. (c) Quantitative analysis of the change in blood perfusion. *p < 0.01 vs. the respective sham groups. # p < 0.05 vs. the VIpost‐0 hr/VIpre. VI, video intensity. Scale bar = 0.5 cm. [Color figure can be viewed in the online issue, which is available at wileyonlinelibrary.com.]
