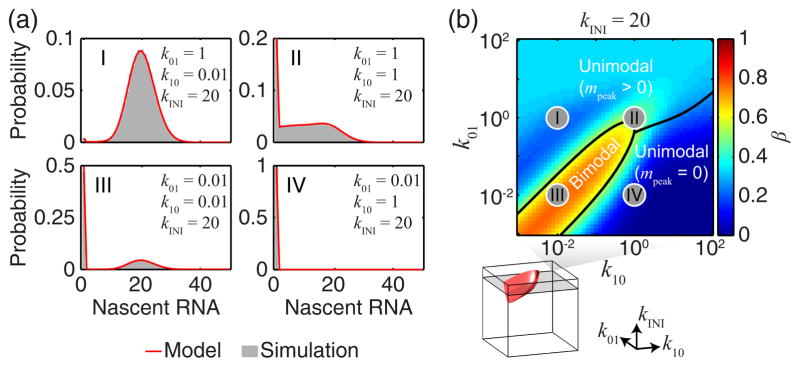
FIG. 2. The probability distribution for the number of RNAPs at the gene.
(a) The exact solution for P(m) (binned to integer values, red) for a few parameter values. Also shown are the results of stochastic simulations (gray). (b) The bimodality coefficient β as a function of k01, k0 and k NI was calculated and thresholded (βth = 5 9 , bottom, red surface) to classify P(m) as either bimodal or unimodal. The unimodal distributions were further classified based on the peak position. Parameter values corresponding to panel a are marked as gray circles.

