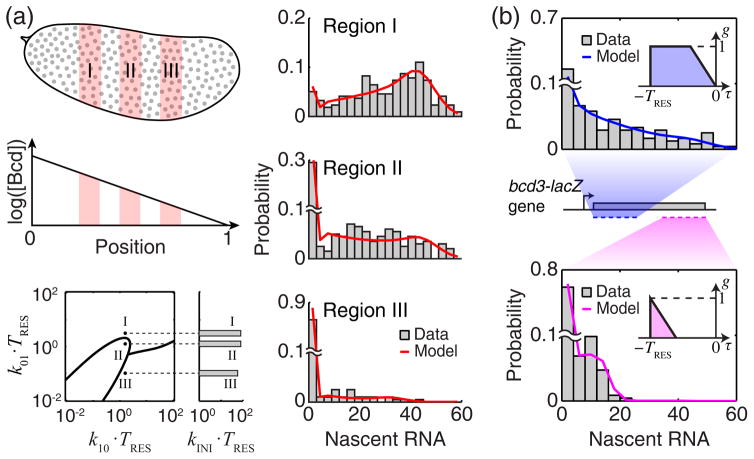
FIG. 3. Estimating transcription kinetics from experimental data.
(a) Regulation of the hb gene by Bcd. Top left, Bcd forms a concentration gradient along the anterior-posterior axis of the Drosophila embryo. Grey circles indicate individual cell nuclei. Three representative regions of the embryo are highlighted in pink, corresponding to high (I), medium (II) and low (III) Bcd concentrations. Right, the measured distribution of nascent hb RNA at each region (smFISH data from a single embryo, >200 data points per histogram, bin width = 3), and the corresponding theoretical fit (red). Bottom left, the estimated transcription parameters (dots), superimposed on the modality phase plane of P(m) calculated as in Fig. 2(b). (b) The effect of smFISH probe positions. Two different sets of probes were designed against the bcd3-lacZ reporter gene, targeting the first half (blue) and second half (magenta) of the gene. The two sets yielded different distributions of nascent RNA (top and bottom, >250 data points from a single embryo, at 0.2–0.3 embryo length, bin width = 4). Using the contribution functions calculated from the probe positions on the gene (insets) yielded a good fit between the model and experimental data.

