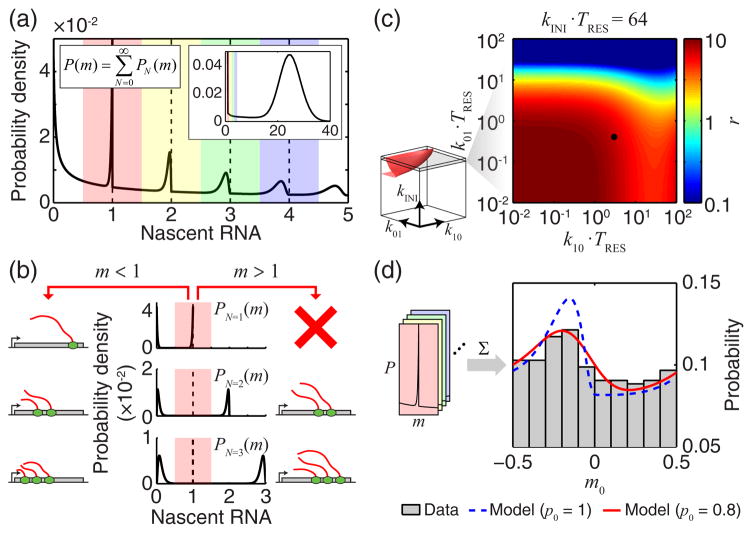
FIG. 4. Discontinuities in nascent RNA distribution at integer m values.
(a) The calculated distribution of nascent RNA at small values of m , for k01 = k0= 0.1 , kINI = 50. A larger range of m is shown in the inset. The range of m was divided into windows covering 0.5 to 0.5 around each integer (colored shading). (b) The origin of discontinuity at m=1. The total probability of observing m is a marginalization over different numbers of RNAPs on the gene (plotted for N=1, 2, 3 ). (c) The discontinuity factor r as a function of k01, k10 and kINI was calculated and thresholded (rth = 0.1, left, red surface). Black dot indicates the experimental data analyzed in panel d. (d) The experimental signature of P(m) discontinuity. Nascent RNA from bcd3-lacZ was measured using smFISH (at 0.1–0.3 embryo length, 23 embryos). The distribution of m0, the deviation of m from the nearest integer, was calculated (gray, 3.5 ≤ m< 6.5, ~500 data points, bin width = 0.1) and compared to model predictions with (red) and without (dashed blue) incorporating the effect of finite probe binding probability p0.

