
Figure 4.
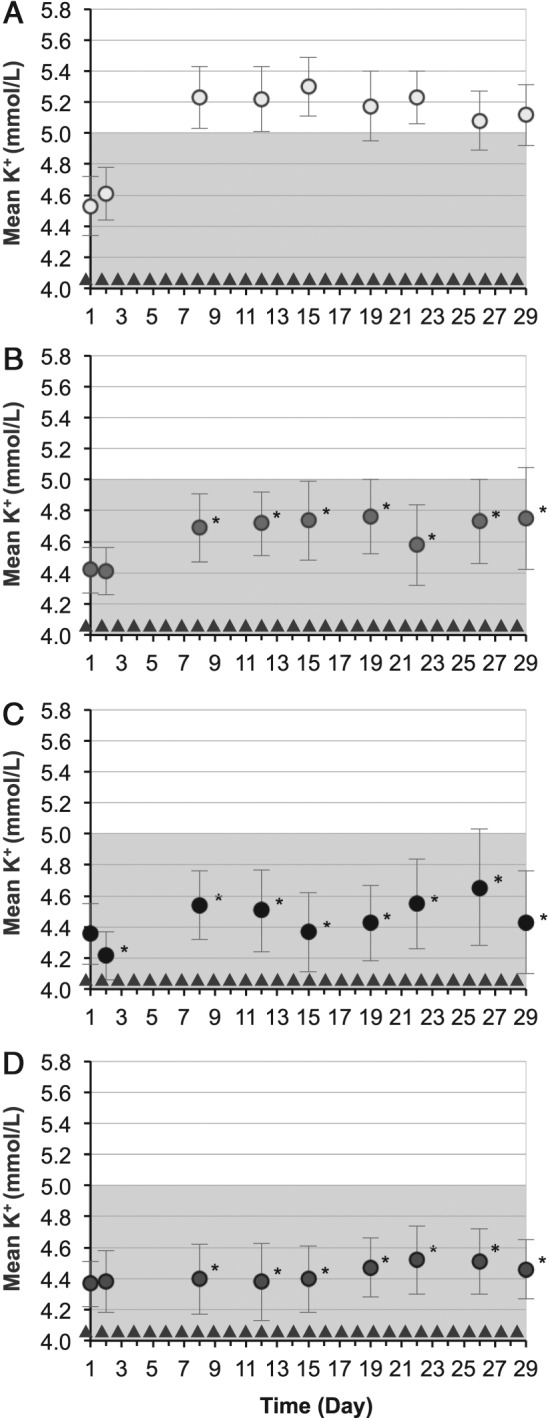
Mean serum potassium over time for the duration of the study (circles): (A) placebo (n = 25), (B) ZS‐9 5 g dose group (n = 18), (C) ZS‐9 10 g dose group (n = 18), and (D) ZS‐9 15 g dose group (n = 24). Triangles indicate administration of ZS‐9 dose or placebo. The shaded portion represents normal potassium levels. Bars indicate 95% confidence intervals. *P < 0.05 for comparisons against placebo.