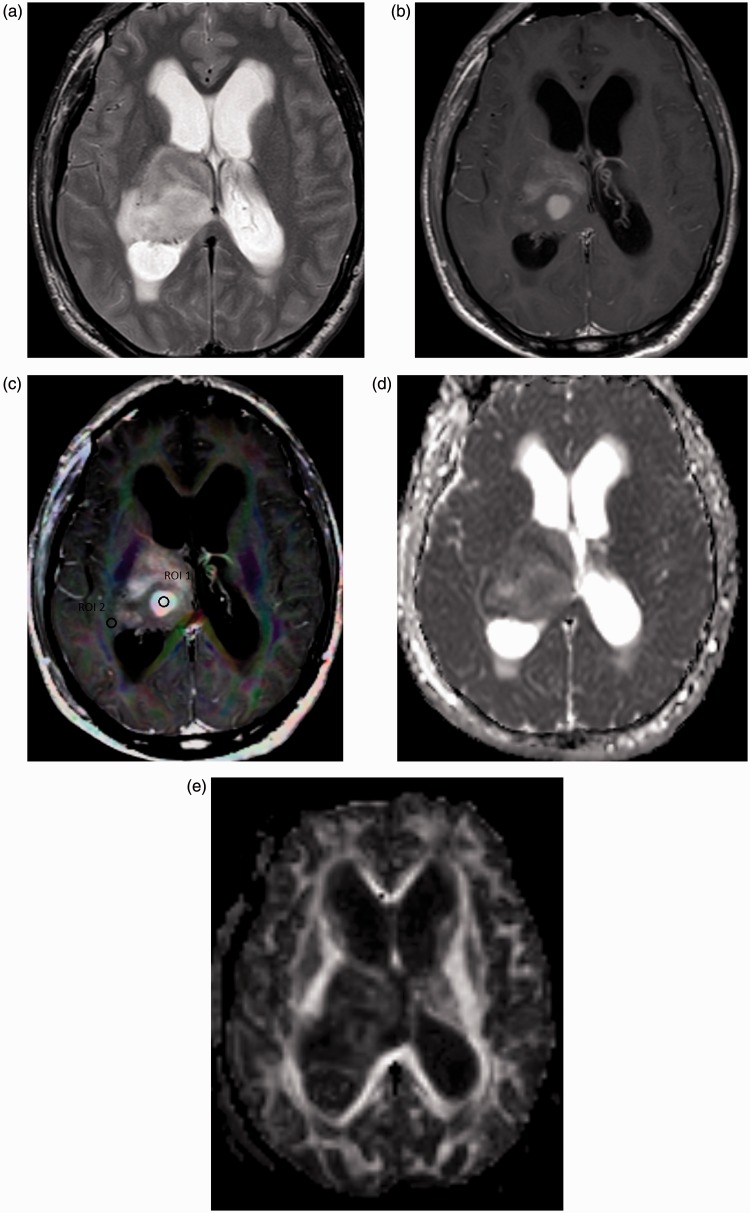
Figure 1.
Grade II astrocytoma. (a) Axial T2-weighted image shows an intra-axial space-occupying lesion of abnormal signal intensity seen in the right thalamic region with hyperintensity in the peri-tumoral region. (b) Axial contrast T1-weighted image shows multiple enhanced nodular areas within the lesion in T2 images. (c) Color FA map co-registered with contrast T1-weighted image shows ROI (1) located within the enhanced solid tumoral part and ROI (2) located in the peri-tumoral region. The MD of the tumoral part is 1.88. The MD, FA, CL, CS and CP of the peri-tumoral part are 1.21, 0.37, 0.41 and 0.78, respectively. (d) MD map shows relative iso-signal of the tumor parts. (e) FA map showing low signal of the solid tumor part. FA: fractional anisotropy; ROI: region of interest; MD: mean diffusivity; CL: linear coefficient; CS: spherical coefficient; CP: planar coefficient.

