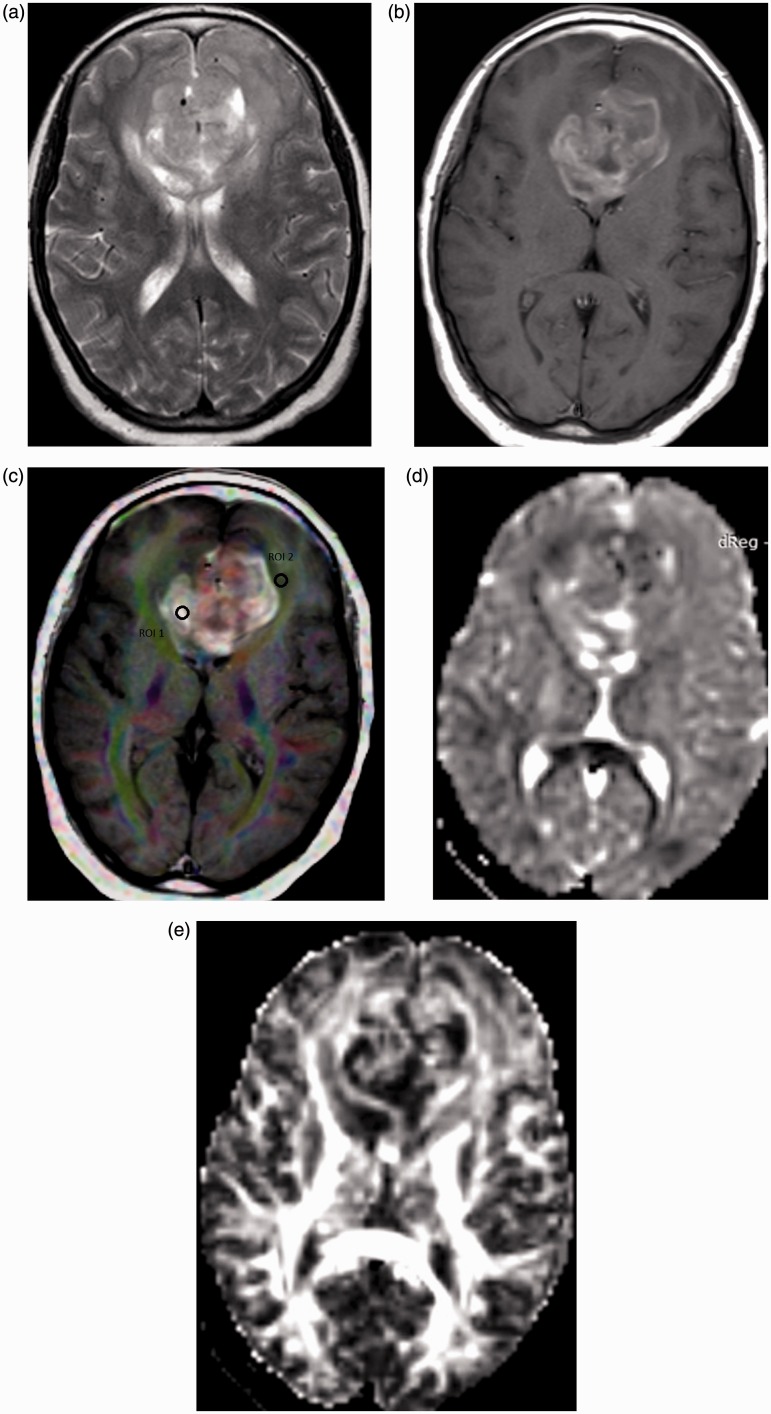
Figure 2.
Glioblastoma multiformis. (a) Axial T2-weighted image shows an intra-axial space-occupying lesion is seen in the genu of the corpus callosum crossing the midline with hyperintensity in the peri-tumoral region. (b) Axial contrast T1-weighted image shows heterogeneous enhancement of the tumor. (c) Color FA map co-registered with contrast T1-weighted image shows ROI (1) located in the enhanced solid tumoral part and ROI (2) located in the peri-tumoral region. The MD of the tumoral part is 1.22. The MD, FA, CL, CS and CP of the peri-tumoral region are 1.72, 0.23, 0.12, and 0.38, respectively. (d) MD map shows an iso-signal with relative low-signal linear areas of the solid tumoral parts. (e) FA map shows heterogeneous mixed mainly low signal of the solid tumoral part. FA: fractional anisotropy; ROI: region of interest; MD: mean diffusivity; CL: linear coefficient; CS: spherical coefficient; CP: planar coefficient.

