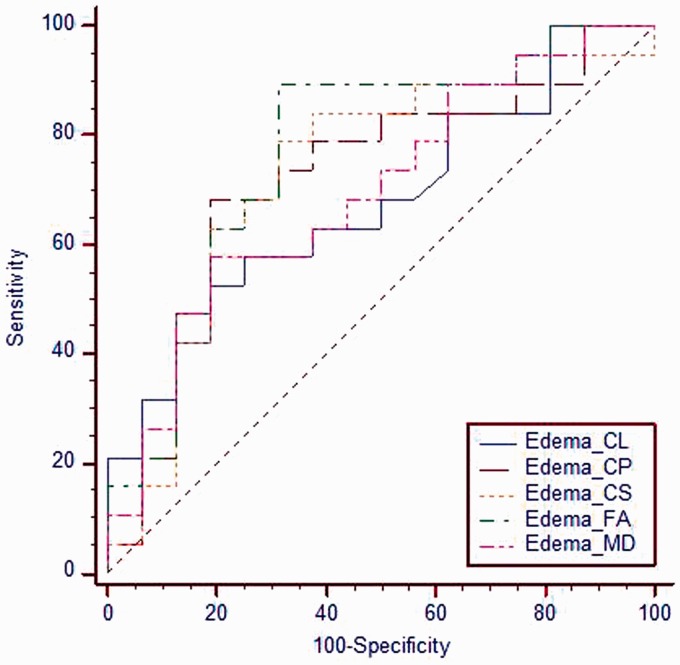
Figure 4.
ROC curve for different metrics of the peri-tumoral region. The cutoff value of MD, FA, CS and CP of the peri-tumoral region used to differentiate low-grade gliomas from high-grade gliomas are 1.24, 0.315, 0.726 and 0.321 with areas under the curve of 0.694, 0.773, 0.734 and 0.724 and accuracy of 68.6%, 80.0%, 74.3% and 74.3%, respectively. ROC: receiver operating characteristic; MD: mean diffusivity; FA: fractional anisotropy; CL: linear coefficient; CS: spherical coefficient; CP: planar coefficient .

