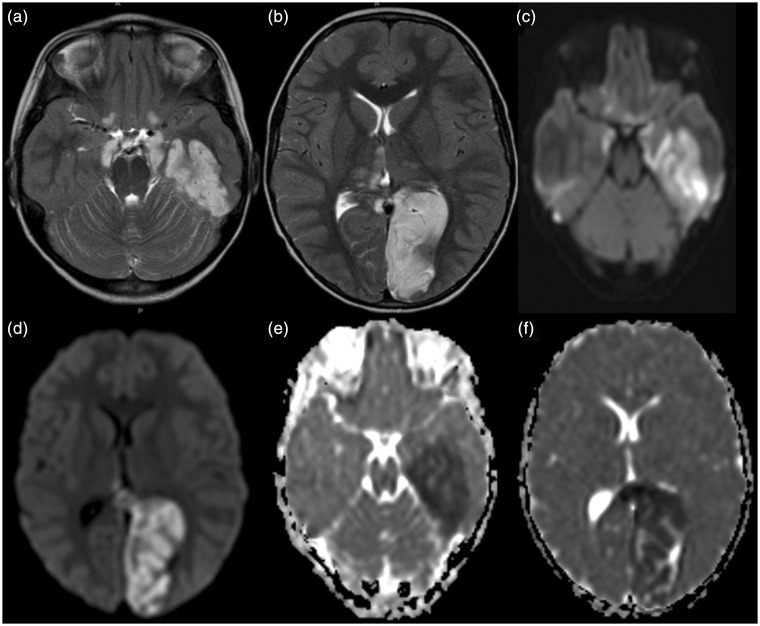
Figure 4.
((a), (b)) Axial T2-weighted MR images, ((c), (d)) trace of diffusion and ((e), (f)) ADC maps of patient 2 performed the subsequent day compared to the CT (Figure 3) reveal T2-hyperintense signal with matching bright signal on trace of diffusion images and reduced ADC values within the vascular territory of the left posterior cerebral artery confirming the acute/subacute arterial ischemic stroke. In addition, T2-hyperintense foci with restricted diffusion are seen within the medial thalami bilaterally, midbrain, bilateral amygdala, posterior inferior aspect of bilateral frontal lobes, and left medial temporal lobe. The last ones are most likely secondary to transtentorial herniation. MR: magnetic resonance; ADC: apparent diffusion coefficient; CT: computed tomography.

