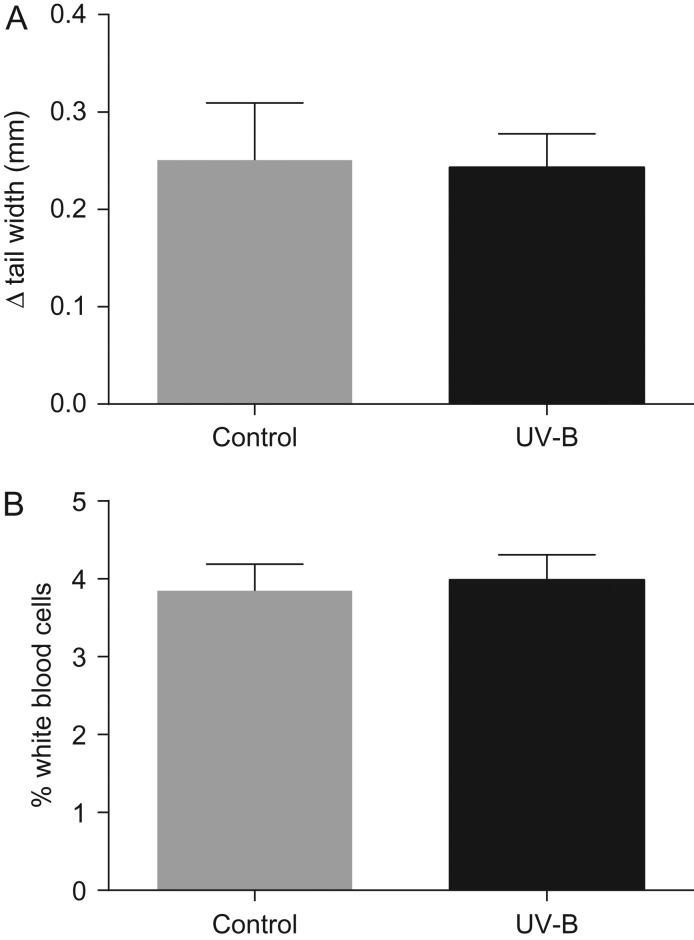
Figure 3:
(A) The mean maximal tail swelling response (in millimetres) to phytohaemagglutinin administration in L. peronii tadpoles in the control treatment (n = 6) and UV-B treatment (n = 8). (B) The mean percentage of leucocytes per 200 blood cells in tadpoles exposed to the control treatment (n = 15) and UV-B treatment (n = 19). There was no significant effect of UV-B exposure on either parameter. Data are presented as mean values + SEM.

