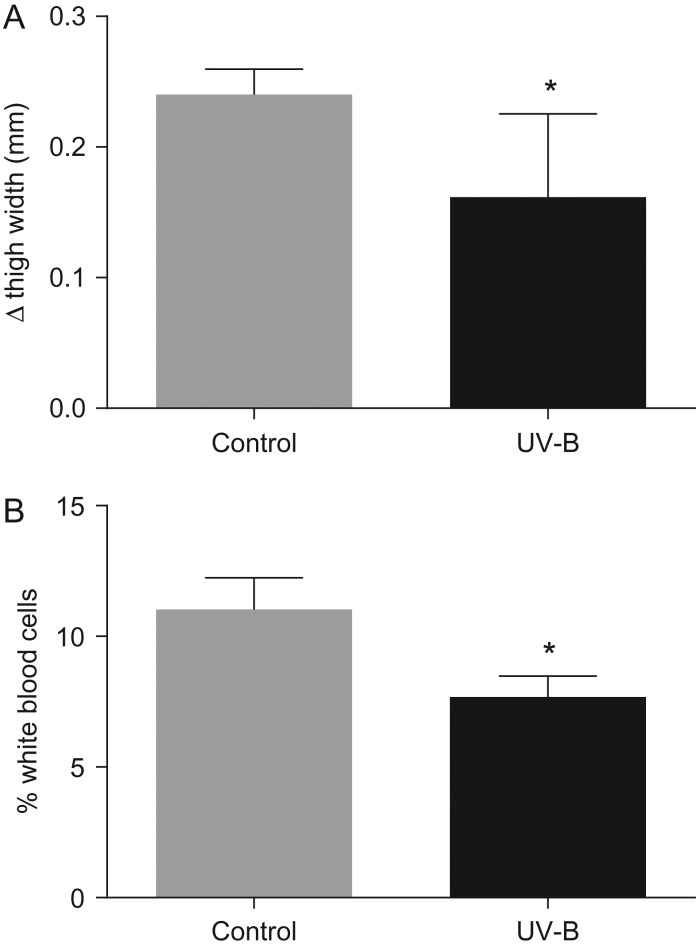
Figure 4:
(A) The mean maximal thigh swelling response (in millimetres) to phytohaemagglutinin injection of L. peronii metamorphs in the control treatment (n = 4) and UV-B treatment (n = 6) during development as tadpoles. (B) The mean percentage of leucocytes of L. peronii metamorphs in the UV-B treatment (n = 11) and control treatment (n = 8) during development as tadpoles. The maximal response to phytohaemagglutinin was greatest in the metamorphs from the control treatment group (F1,8 = 0.93, P = 0.002). The proportion of leucocytes was also greatest in the control treatment group (F1,17 = 5.6, P = 0.03). *Significant difference (P < 0.05) between the UV-B and control treatment groups.

