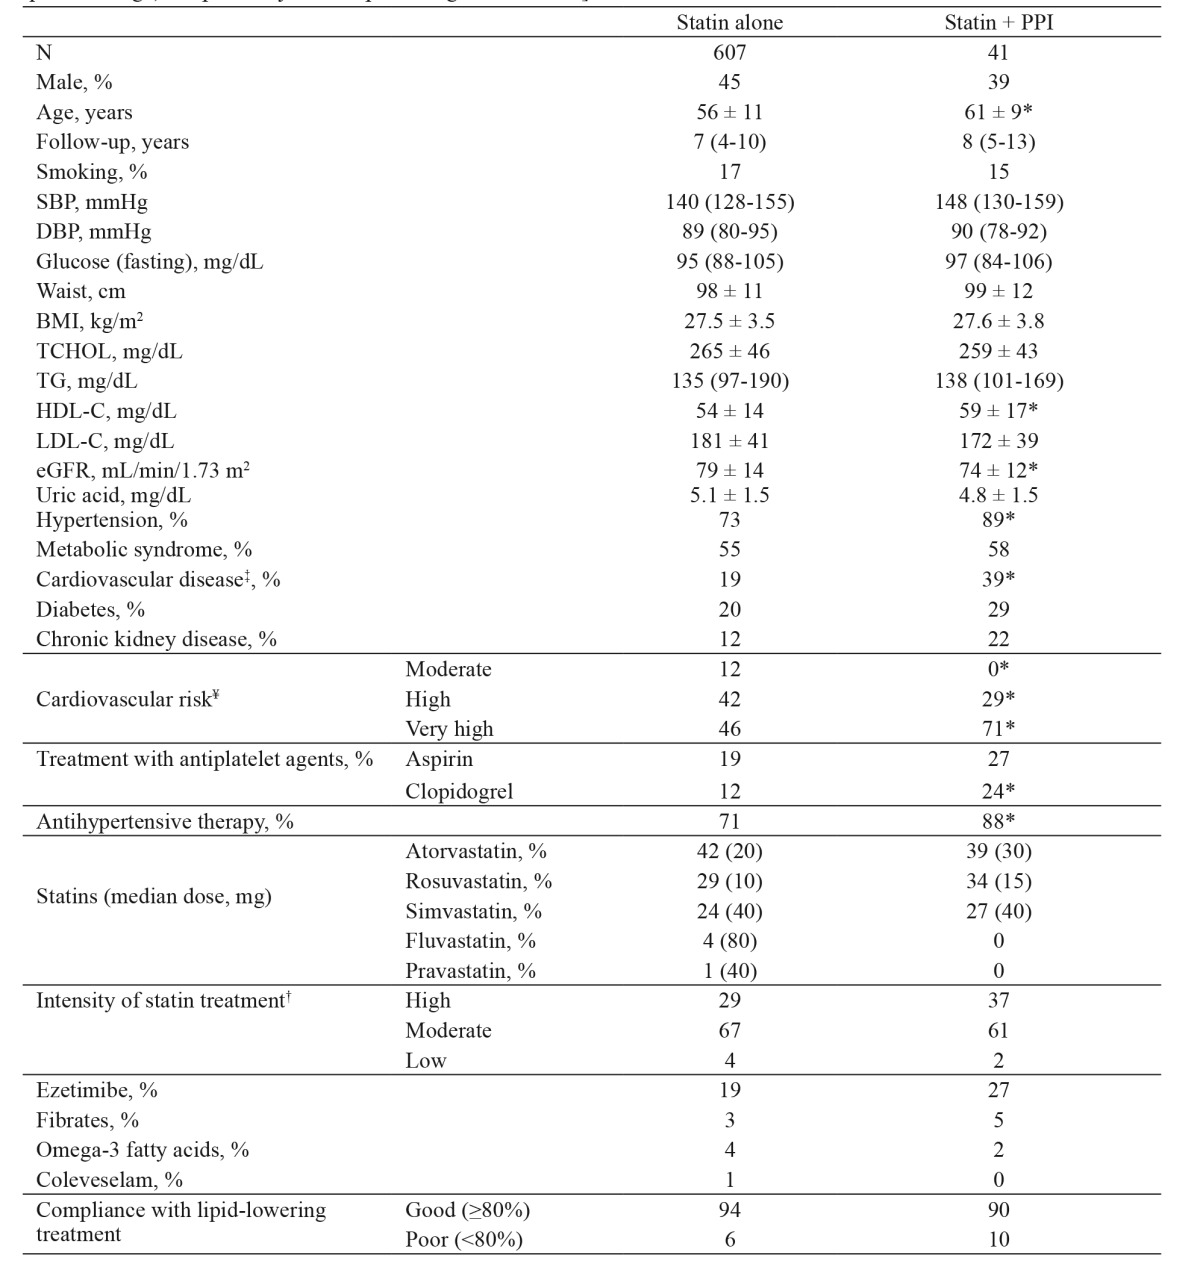
Table 1. Baseline characteristics of 648 subjects enrolled retrospectively in this observational study and treatment at the most recent visit [Parametric and non-parametric values are expressed as mean ± standard deviation and median (interquartile range), respectively, unless percentages are shown].

PPI: proton pump inhibitors, SBP: systolic blood pressure, DBP: diastolic blood pressure, BMI: body mass index, TCHOL: total cholesterol, TG: triglycerides, HDL-C: high-density lipoprotein cholesterol, LDL-C: low-density lipoprotein cholesterol, eGFR: estimated glomerular filtration rate. To convert from mg/dL to mmol/L multiply by 0.02586 for TCHOL, HDL-C and LDL-C, by 0.01129 for TG and by 0.06 for glucose. ‡: Cardiovascular disease comprised of coronary heart disease, stroke, aneurysm, peripheral arterial disease and carotid stenosis ≥50%. ¥: Cardiovascular risk was classified according to European Society of Cardiology (ESC)/European Atherosclerosis Society (EAS) guidelines for the management of dyslipidemias3. †: Intensity of statin treatment is based on the average expected low-density lipoprotein cholesterol reduction (≥50, 30-50 and <30%, respectively)14. *: p <0.05 for the comparison between subjects on statin alone and those on statin + PPI.
