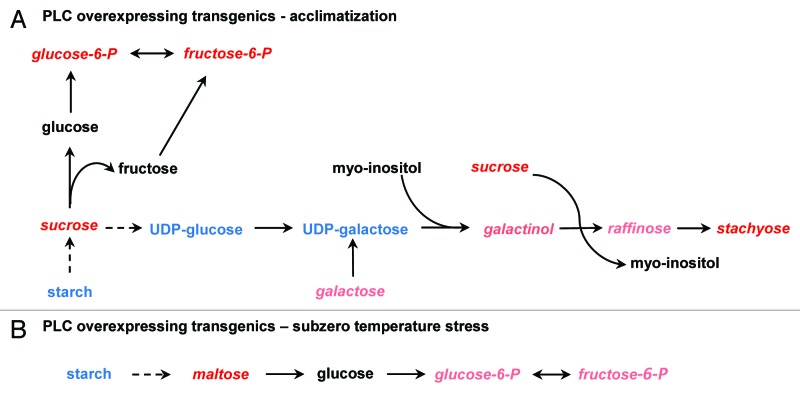
Figure 2. Changes in carbohydrates metabolism in transgenic line (S18) overexpressing BnPLC2 gene under the conditions of acclimatization (A) and subzero temperature stress (B). Metabolites in red italics indicate higher level at this treatment conditions compared with control. Pink italics indicate biochemicals stably increased in other biological replicates of this experiment. Blue font indicates biochemicals not detected in this study and black font, unchanged metabolites.

An official website of the United States government
Here's how you know
Official websites use .gov
A
.gov website belongs to an official
government organization in the United States.
Secure .gov websites use HTTPS
A lock (
) or https:// means you've safely
connected to the .gov website. Share sensitive
information only on official, secure websites.
