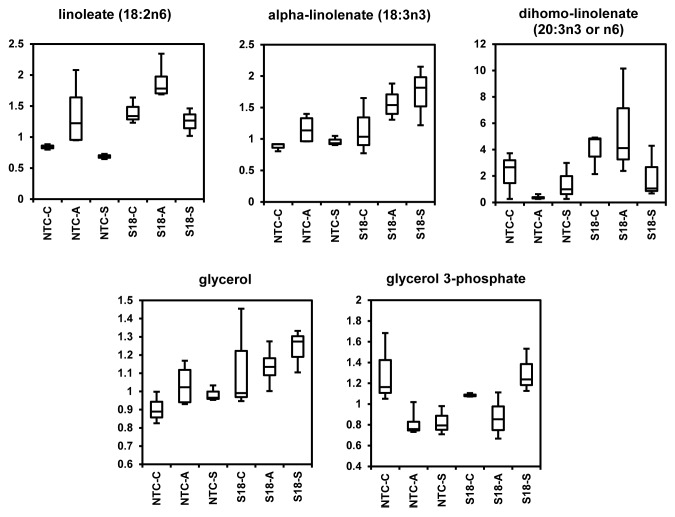
Figure 3. Box Plots representation of the amounts of linoleate (18:2n6), α-linolenate (18:3n3), dihomo-linolenate (20:3n3 or n6), glycerol and glycerol 3-phosphate in line S18 overexpressing BnPLC2 gene relative to NTC, grown under normal control conditions (C) and subjected to acclimatization (A) at +4 °C for 7 d and subzero stress (S) at -5 °C for 12h. The box represents the middle 50% of the distribution and upper and lower whiskers represent the entire spread of data. Horizontal line in the box body represents the median value. The y axis is a relative level (median scaled value). The P values for all comparisons are referenced in Table S2.

An official website of the United States government
Here's how you know
Official websites use .gov
A
.gov website belongs to an official
government organization in the United States.
Secure .gov websites use HTTPS
A lock (
) or https:// means you've safely
connected to the .gov website. Share sensitive
information only on official, secure websites.
