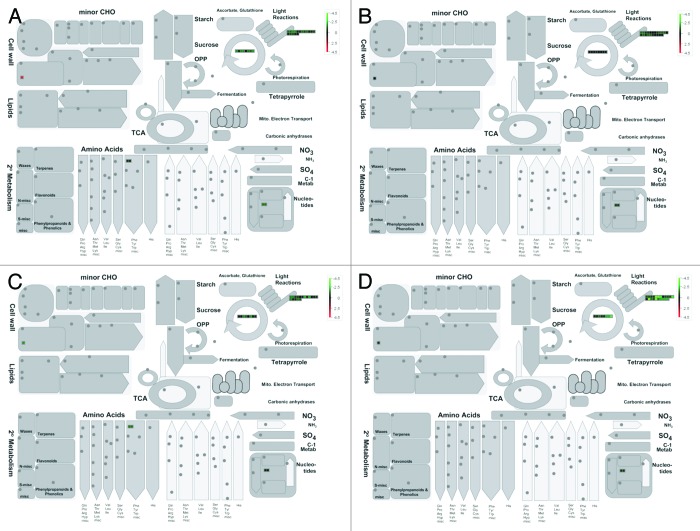
Figure 4. Differential expression of genes (log-scale) under drought treatment in two tissues at two different time points involved in flax metabolism grouped into different bins. Green indicates downregulated genes; red indicates upregulated genes. (A) Four day stressed shoot. (B) Four day stressed root. (C) Five day stressed shoot. (D) Five day stressed root.

An official website of the United States government
Here's how you know
Official websites use .gov
A
.gov website belongs to an official
government organization in the United States.
Secure .gov websites use HTTPS
A lock (
) or https:// means you've safely
connected to the .gov website. Share sensitive
information only on official, secure websites.
