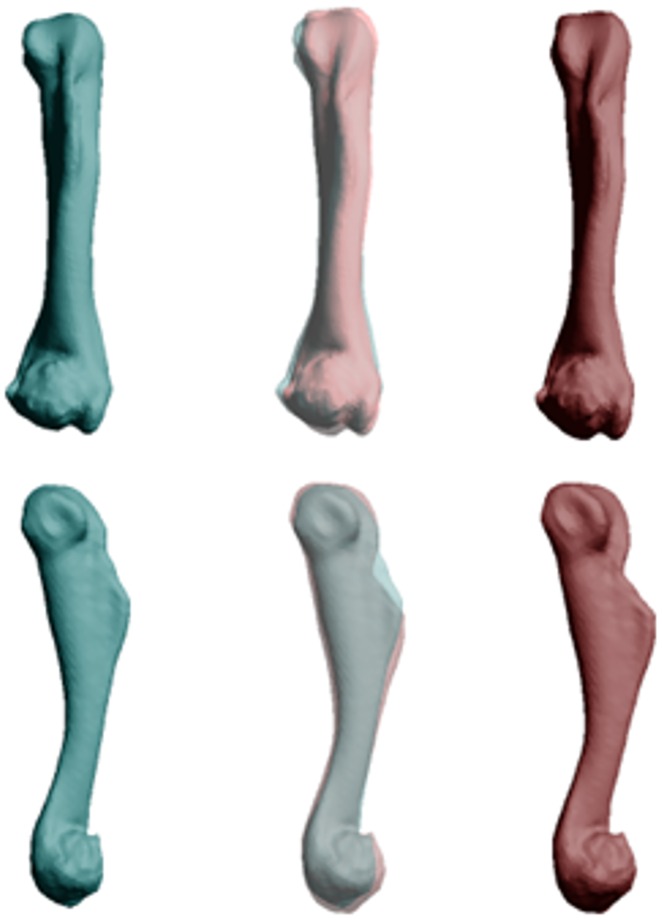
Fig 3. Differences in morphology of the humerus between populations of cane toads based on scans of 19 specimens (10 QLD, 9 WA).
The images show mean values for cane toads from long-colonised (left, blue) and invasion-front populations (right, red). The central image overlays the ones on either side to reveal points of divergence, in this case reflecting a transformation from a low (-0.04) to high (0.04) PC1 score.

