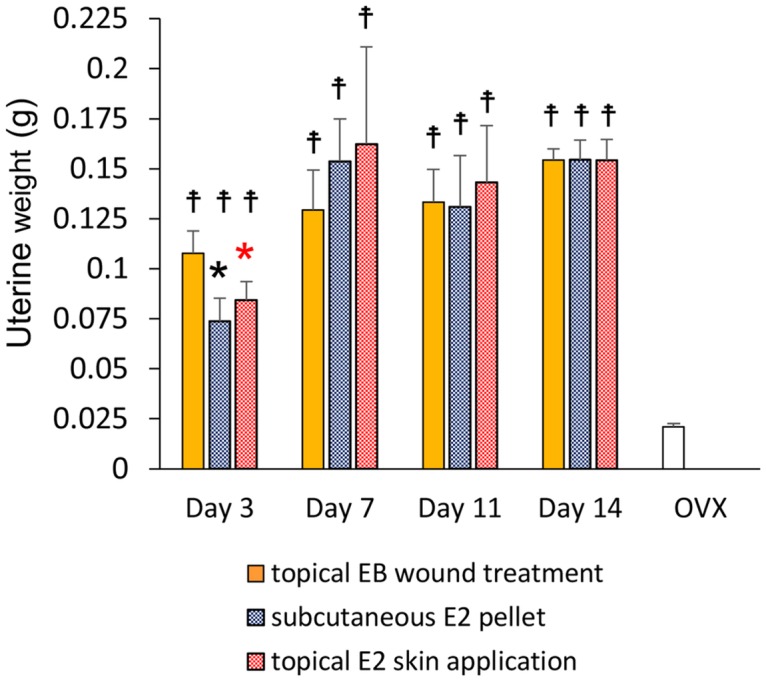
Fig 1. Uterine weight.

Uterine weights are shown in box graphs. Values are expressed as the mean ± SD, n = 5–7 for each group, ANOVA, Tukey-Kramer *p<0.05 (in black): the topical EB wound treatment group versus the subcutaneous E2 pellet group, *p<0.05 (in red): the topical EB wound treatment group versus the topical E2 skin application group, ☨p<0.05: versus OVX.
